
Gold Bugs Index Breaking 13 Year Support
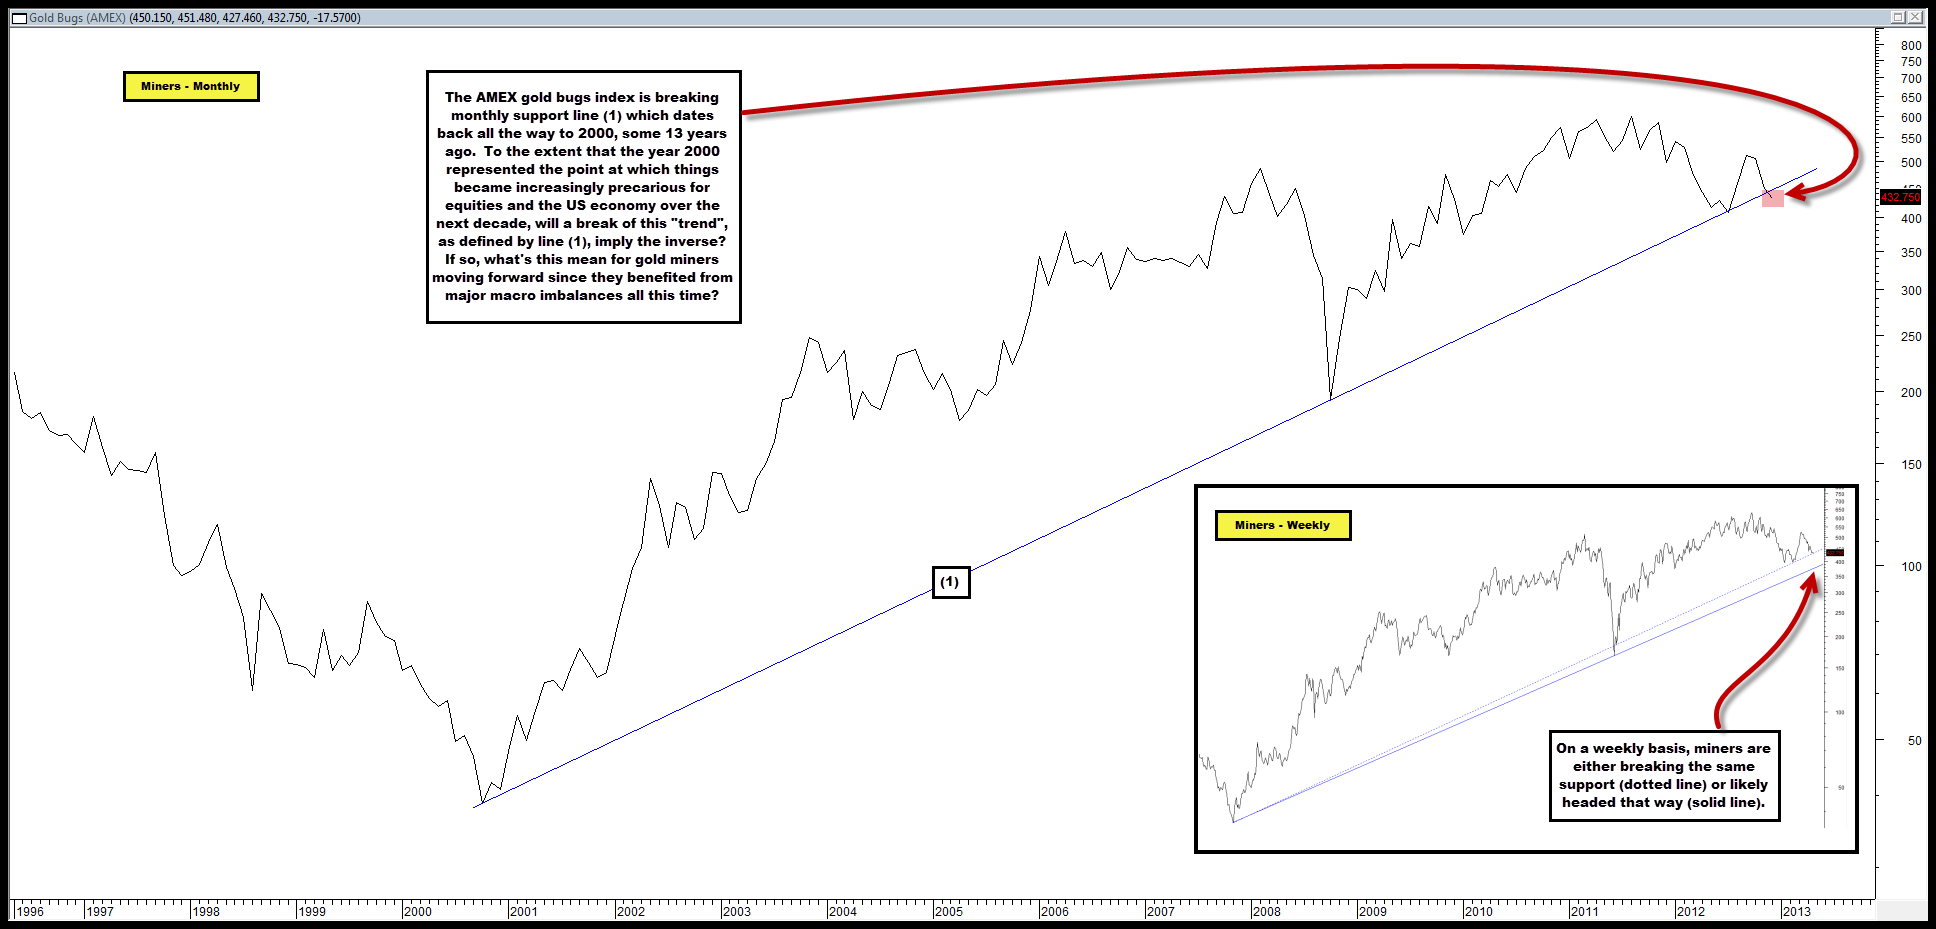
The AMEX Gold Bugs Index is breaking 13 year monthly support line (1) in the chart below, dating back to 2000.
We also provide an inset of the same chart on a weekly basis – it appears as if it’s also breaking support (dotted line) or if that support is drawn somewhat differently (solid line), like it’s headed for a break.
Though we don’t use monthly charts that often, we believe the break of support on a monthly basis is quite relevant for this index, given the longer-term macro implications it seems to be suggesting.
For instance, line (1) support begins in 2000, which effectively represents the point in time where the U.S. economy and its equity markets became increasingly precariously positioned over the coming decade.
With this in mind, since line (1) has defined this trend toward greater instability, does a break thereof now imply the opposite for the U.S. economy and its equity markets?
Moreover, since the AMEX Gold Bugs Index has done so well over the past 13 years as the trend defined by line (1) has been in place, does the break now imply the opposite as the U.S. economy potentially mends itself?
Not sure, but can’t imagine a 13 year support line breaking being bullish for this group.
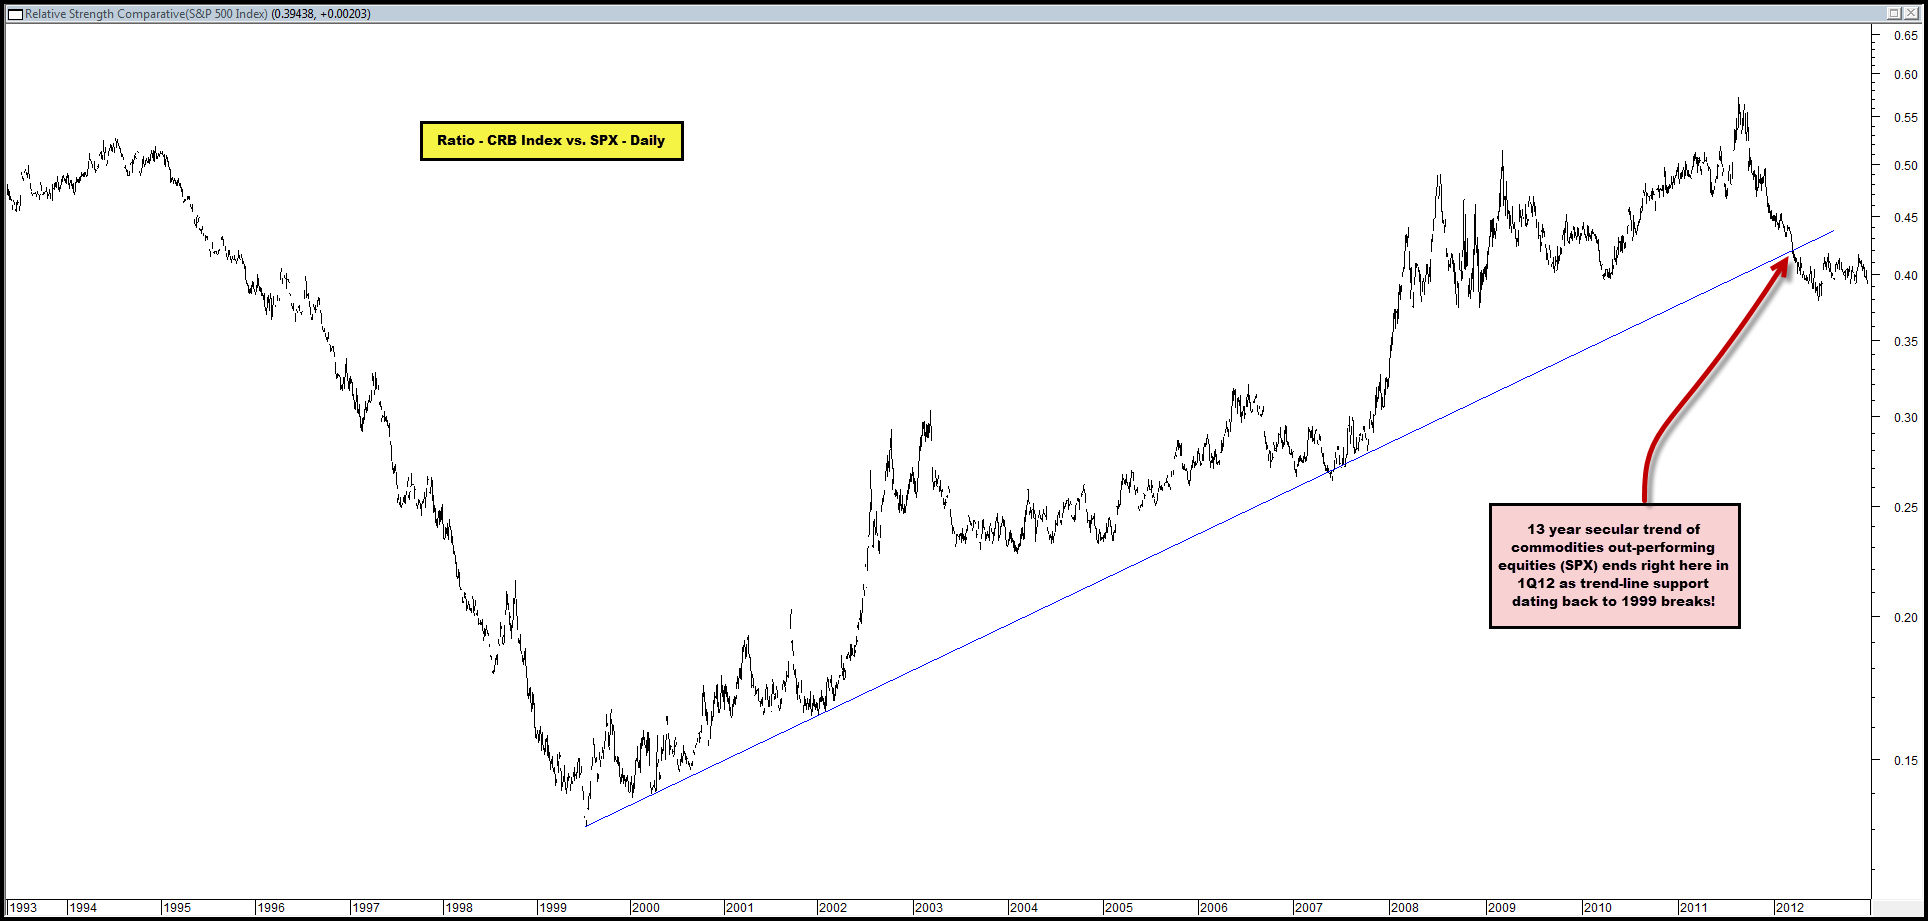
And ultimately, we are not that surprised to see this technical development given that the secular trend of commodities (and derivatives thereof) out-performing ended all the way back in 1Q12 when the ratio of the CRB Index vs. SPX broke support in the chart below that dated all the way back to 1999.
It seems only logical then that gold miners might follow suit. In effect, they’re merely three quarters late in discounting what commodities in general discounted earlier in 2012.
Comments are closed, but trackbacks and pingbacks are open.