
Russell 2000 Faces Resistance on a Relative Basis & Could Under-Perform for Years
We continue to believe this today.
Even if the USD fails to rally, the mere possibility of its downside beginning to abate in the future is likely to lead to small-caps under-performing, just as oil failing to rally (vs. actually declining) implies the potential for airlines to out-perform.
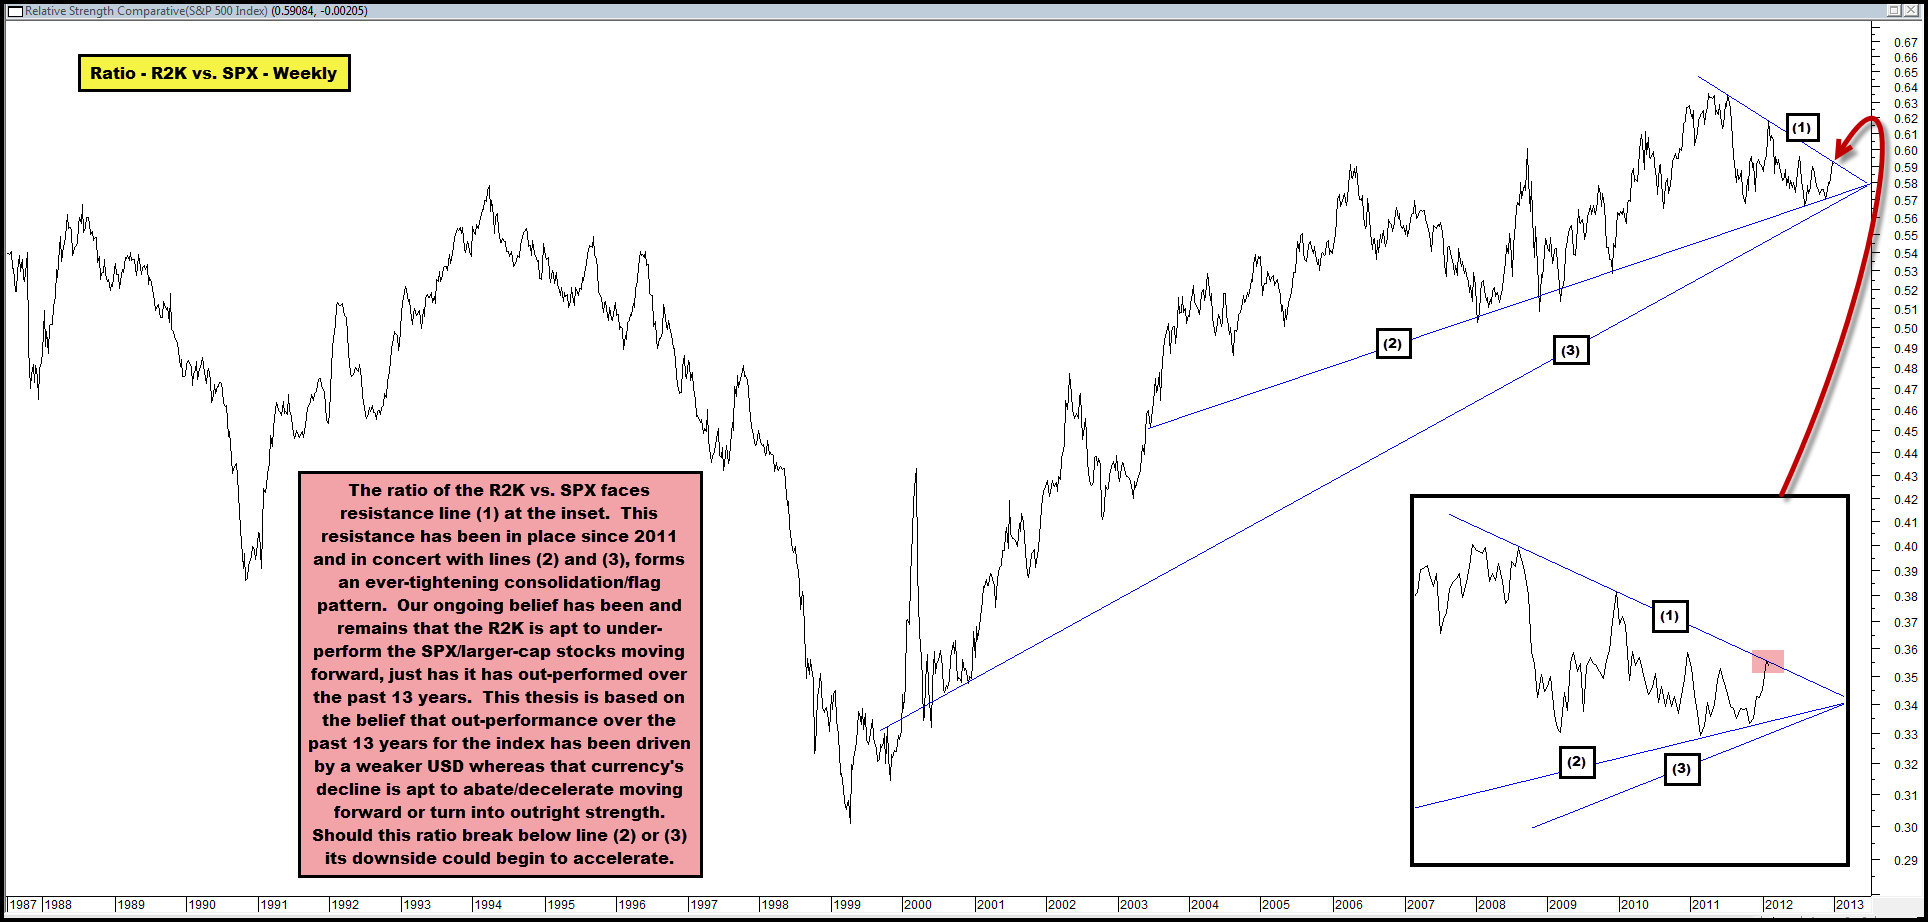
With all of the above in mind, we point out that the ratio of the R2K vs. SPX faces resistance line (1) in the chart below, which has been in place since 2011.
This line forms the top end of an ever-tightening consolidation pattern, flanked by lines (2) and (3) as support.
Should the ratio break below support lines (2) and (3) we believe it’s downside, and the R2K’s under-performance vs. the SPX/large-caps, could accelerate.
Remember, the R2K has out-performed the SPX by a factor of 2x+ over the past 13 years as the USD has weakened!
We would also point out that small-caps under-performing need not imply the broader market be weak – look at how weak this ratio was from 1993-2000 as the broader market had its best bull in 70 years!
Comments are closed, but trackbacks and pingbacks are open.