NYSE 52 Week Lows Once Again at Levels that Have Coincided with SPX Pull-Backs Over Past Year+
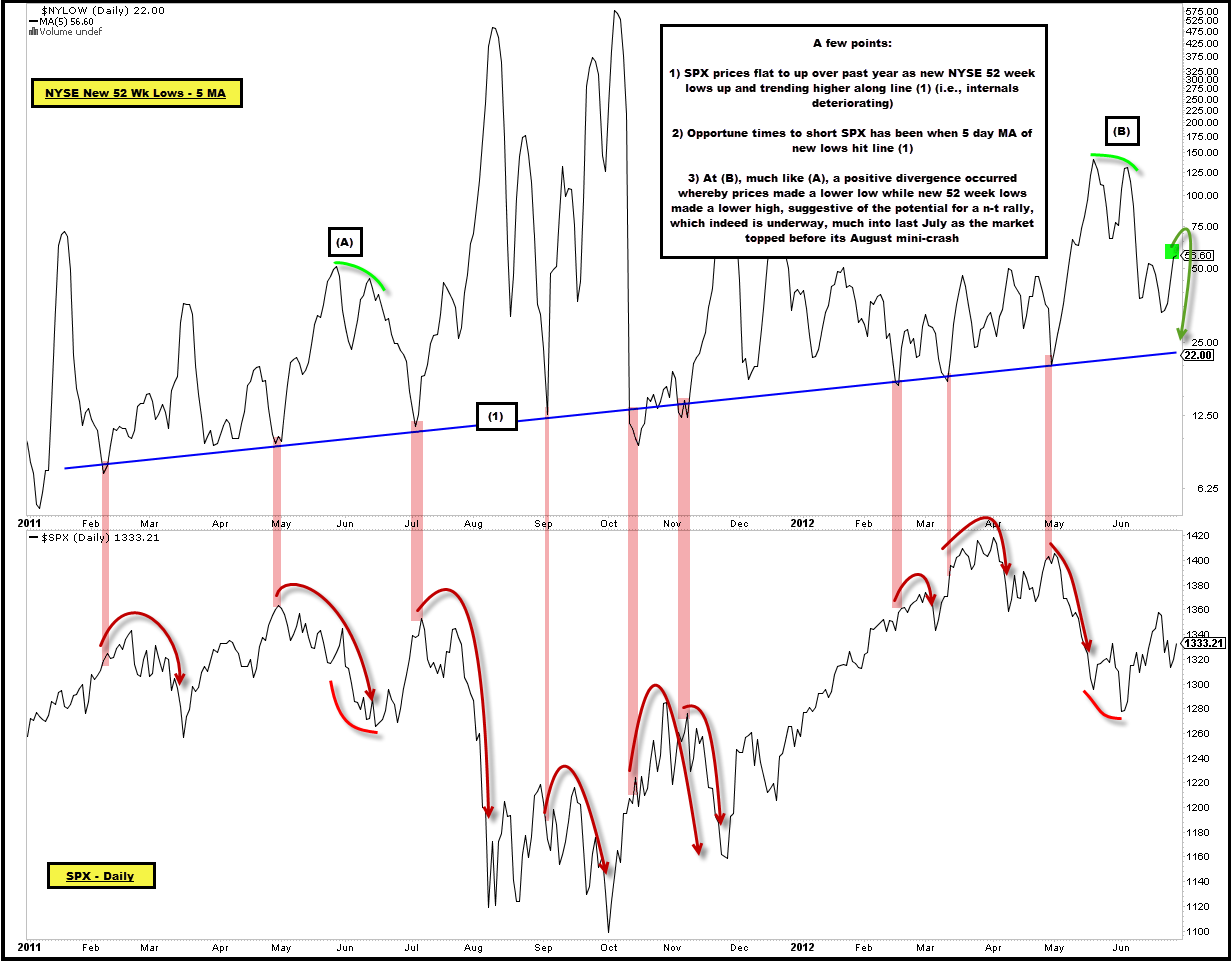
On 6/27 we noted that new 52 week lows on the NYSE had been trending higher over the past year even as the SPX was flat to up.
We also noted that if history held, it was likely not the best time to begin shorting the SPX as it stood at 1,333 as the most opportune time to do so over the past year had been when the 5 day moving average (MA) of new 52 week lows on the NYSE had fell to trend-line support in the original chart, reproduced below.
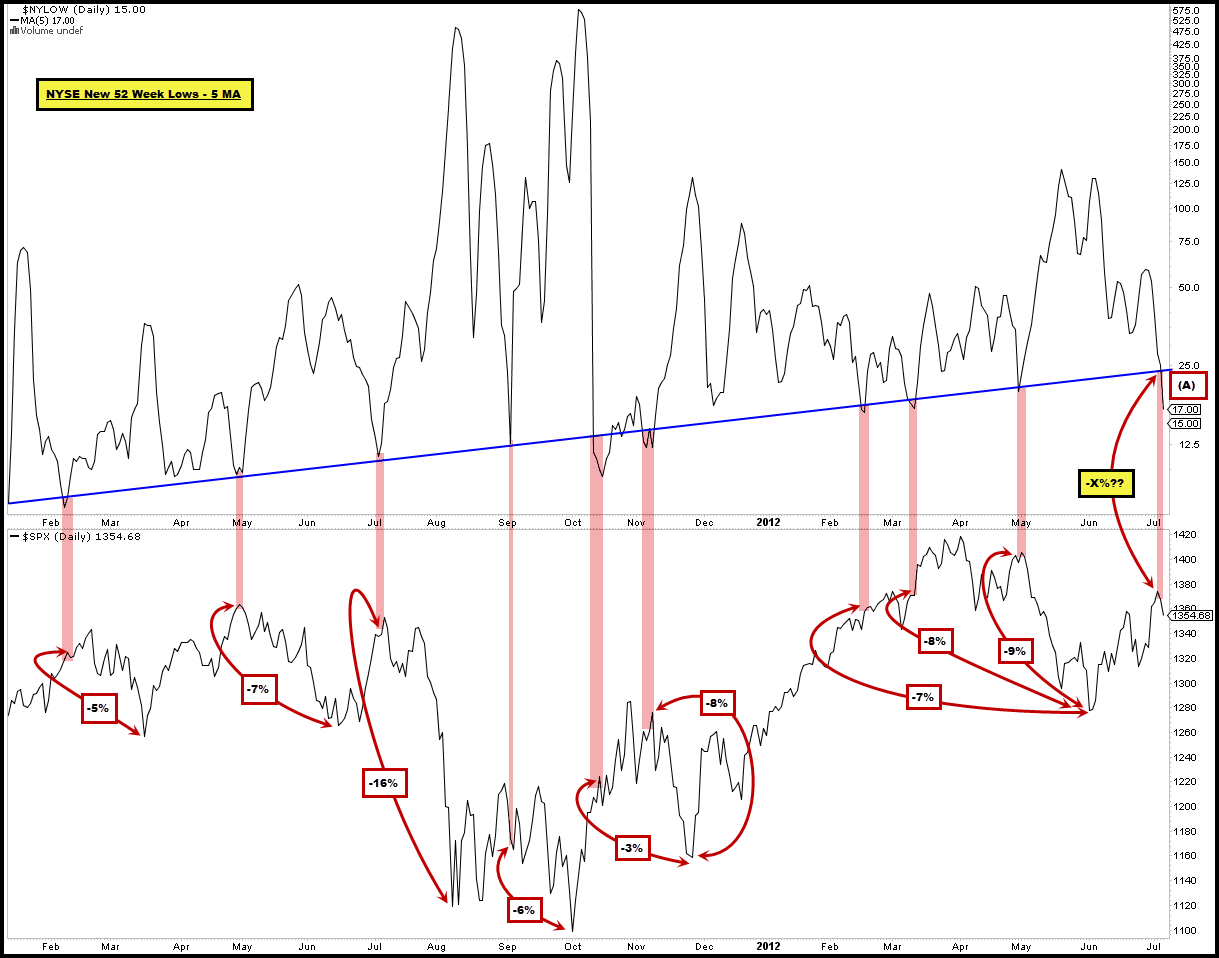
Fast forward roughly two weeks and at the SPX’s recent high of ~1,375 the market had rallied ~300 bps since the time of our original post bringing new 52 week lows down to trend-line support at (A), ironically right where the SPX itself once again began to roll over.
Since last Spring, shorting the SPX when new 52 week lows on the NYSE have reached the trend line in the chart above has been 100% successful, yielding profits nine times out of nine opportunities with the average gain on a short position being ~765 bps (smallest 300, largest 1,600).
Will history repeat given what just happened at (A)? So far, the SPX is down ~150 bps since new 52 week lows touched trend-line support.


Comments are closed, but trackbacks and pingbacks are open.