Charting RIMM’s Recent 50% Drop / The Power of Technicals (Part 2)
Starting now, we’re going to begin a series that shows recurring technical set-ups that offer material profit opportunities in compressed periods of time.
In other words, great reward/risk trades.
We’ll present these opportunities to folks subscribing to the premium / password-protected content first and then to broader readership down the road once the opportunities have been harvested (or if we’re wrong, stopped out).
On June 25, in part 1 of this series, we highlighted RGR and noted that despite it and its industry’s great fundamental back drop, the stock had fallen ~40% in a little over a month.
We presented a simple, yet compelling technical reason this had happened – the stock ran into material long-term resistance that had produced similar declines in the past.
Today we look at the recent ~50%, two month implosion in RIMM.
In a nutshell, a similar application of “drawing silly lines” on a chart and having a simple understanding of technical analysis, much like the RGR example, would have allowed one to successfully trade this decline, either shorting RIMM outright or owning, deep out of the money put options.
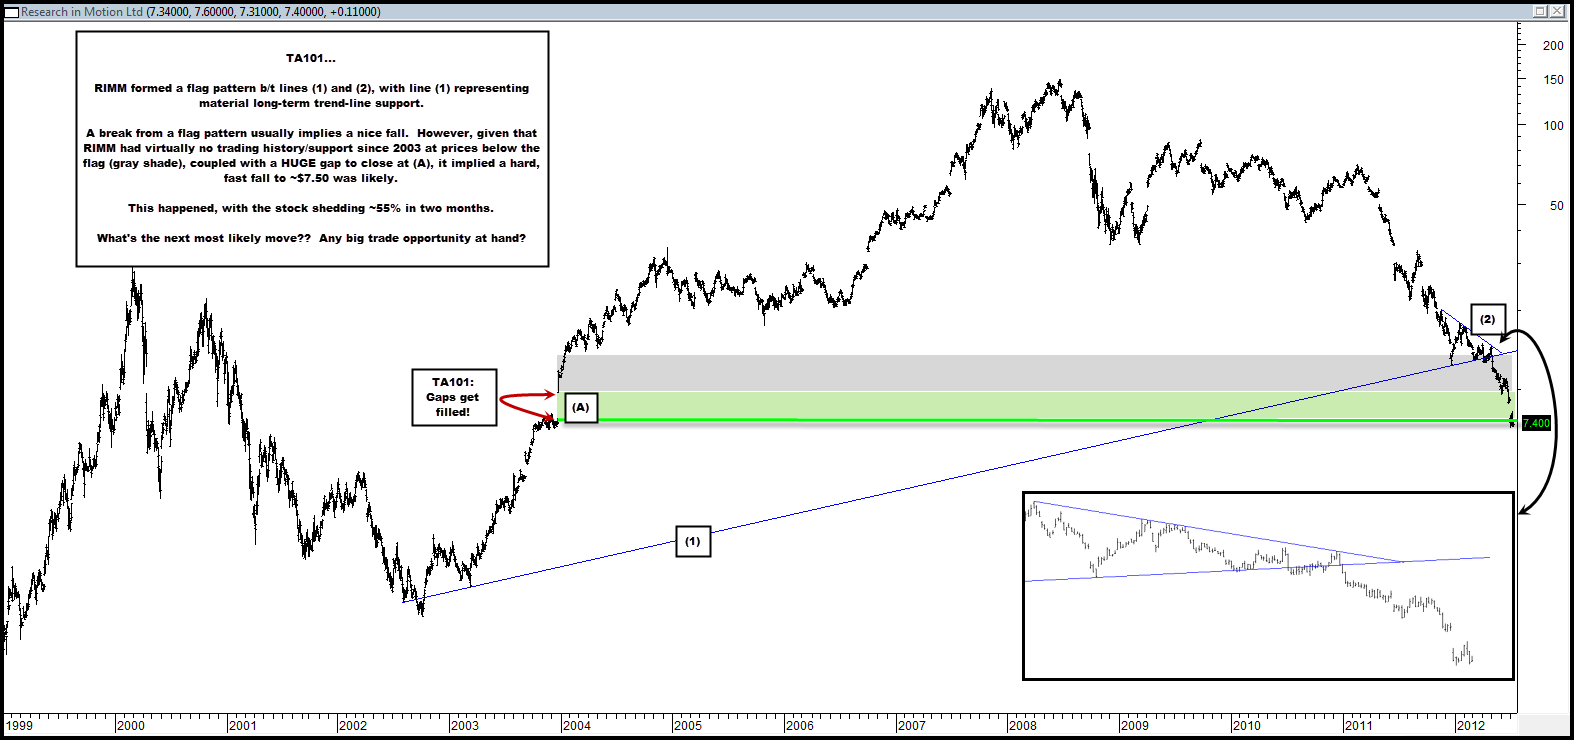
In the chart below we highlight technical analysis 101 – RIMM formed a flat pattern b/t lines (1) and (2) a few months ago when it stood at ~$14.50.
Line (1) was trend-line support from 2002 – important support.
As the gray shade shows, a break below this flag had virtually no trading history / support in terms of price action, dating back nearly a decade to 2003.
Moreover, at (A), there was a HUGE gap to fill at ~$7.50-$7.75. Gaps get filled! The green shade shows this gap.
As such, any break below the flag suggested the probability of a hard and fast fall to at least $7.50 was likely, to successfully close this gap.
Question is – after a ~50% decline in two months, what’s the next big oppotunity here?

Comments are closed, but trackbacks and pingbacks are open.