Time for Equities to be Worried?
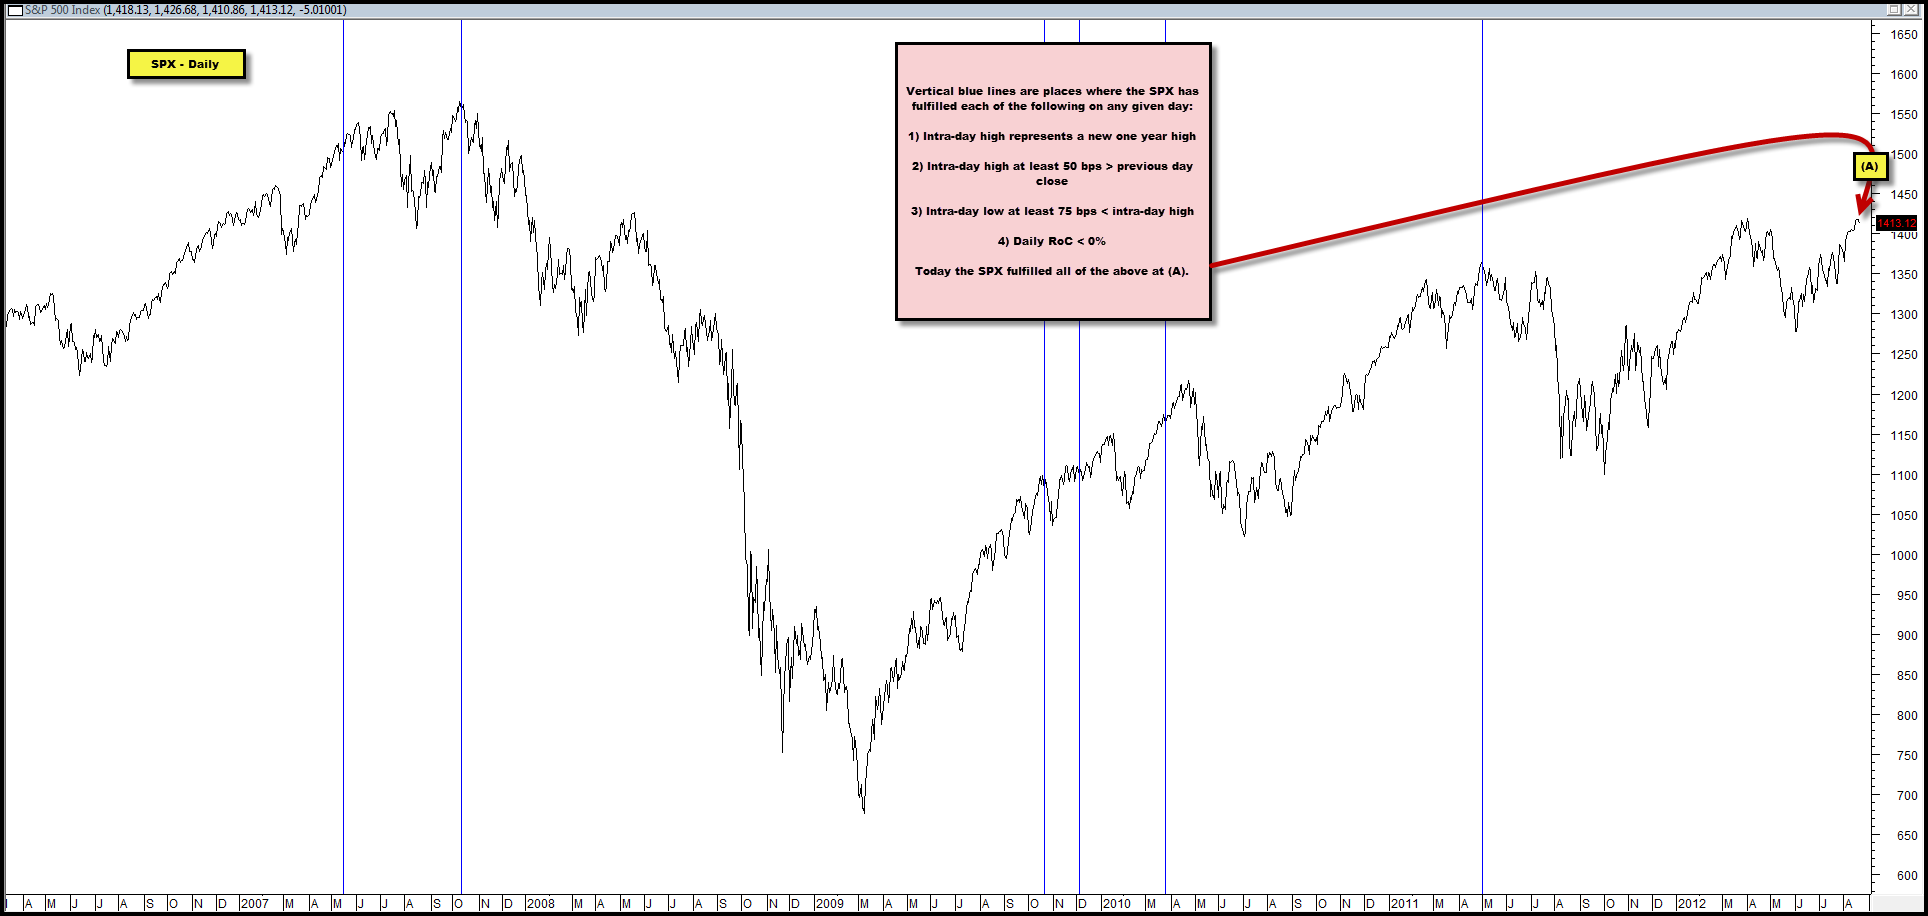
Chart below shows locations on the SPX where each of the following are fulfilled:
1) Intra-day high represents a new one-year high
2) Intra-day high at least 50 bps > previous day close
3) Intra-day low at least 75 bps < intra-day high
4) Daily RoC < 0%
Today the SPX fulfilled all of the above at (A) and has done so only a few times since 2007, with nearly every instance being at or very close to an important top.
In effect, we’re looking for what we would suggest is bearish price action (large intra-day reversal) at fresh one-year highs, which can often times be indicative of exhaustion.
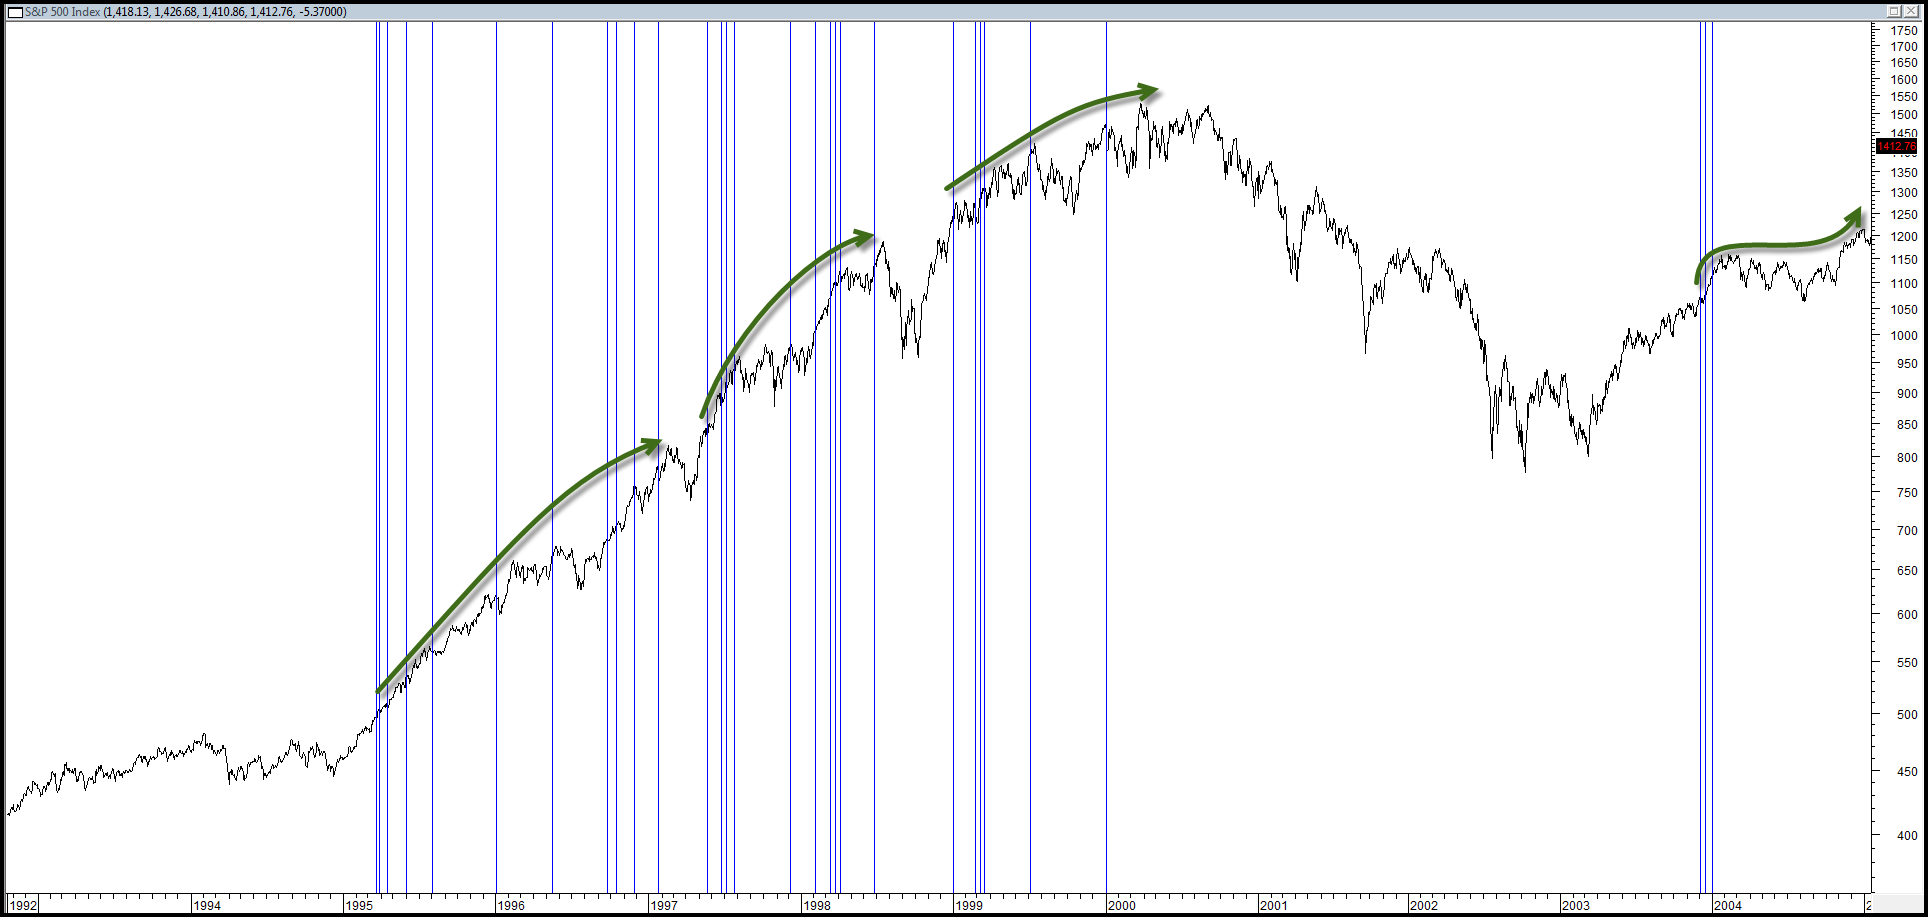
As an FYI though, these conditions did NOT produce similar results in the 90s as this signal was produced numerous times during 1993-2003 with the SPX registering additional gains thereafter, in near unabated fashion, as the chart below shows.
So, which period do you think is more relevant to today’s environment?
2007 onward, or 1993-2003?


Comments are closed, but trackbacks and pingbacks are open.