GOOG’s Day in the Sun is Likely Arriving with $1,000 in the Cards
Even as AAPL has risen some ~225% from its highs in 2007 GOOG shares are still DOWN 3% after peaking in the same year.
We believe GOOG’s fortunes are in the process of changing as is the market’s perception of the company’s Droid phones relative to the iPhone (personal note – we have owned every iPhone since the original in 2007 and for the first time just switched to a Droid Samsung Galaxy S3 – it kicks the pants off iPhone, but is more cumbersome and onerous to learn).
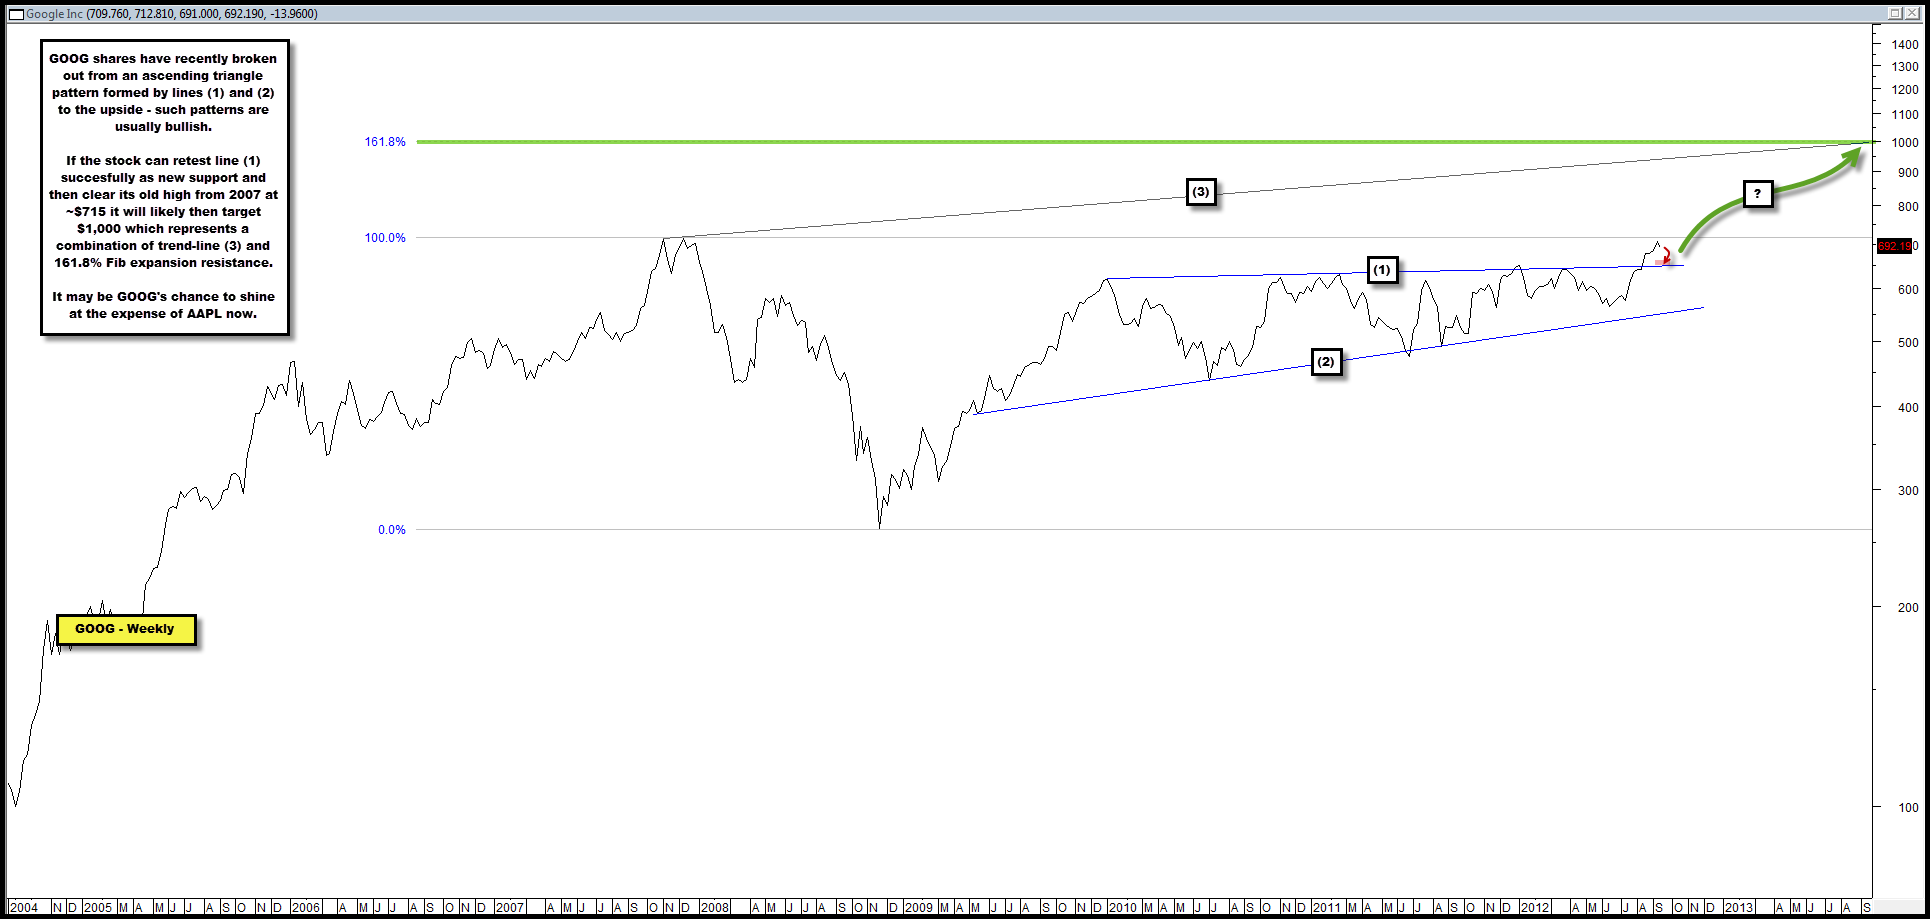
In the chart below GOOG appears to have broken above a multi-year ascending triangle pattern formed by lines (1) and (2).
Such patterns are typically bullish in nature.
If GOOG can re-test line (1) as new support successfully and then clear its previous high in 2007 around ~$715, we would anticipate the stock to test trend-line resistance (3) at ~$1,000, which ironically, also represnets its 161.8% Fib expansion level formed b/t the stock’s 2007 highs and 2008 lows.
Also – seasonals are very strong for GOOG in October historically since its IPO, with 7 up months and only 1 down month and the average gain coming in at a remarkable ~17%!

Comments are closed, but trackbacks and pingbacks are open.