Aussie $ Appears to be Fading at Important Test of Resistance
Chart below is of the Aussie $.
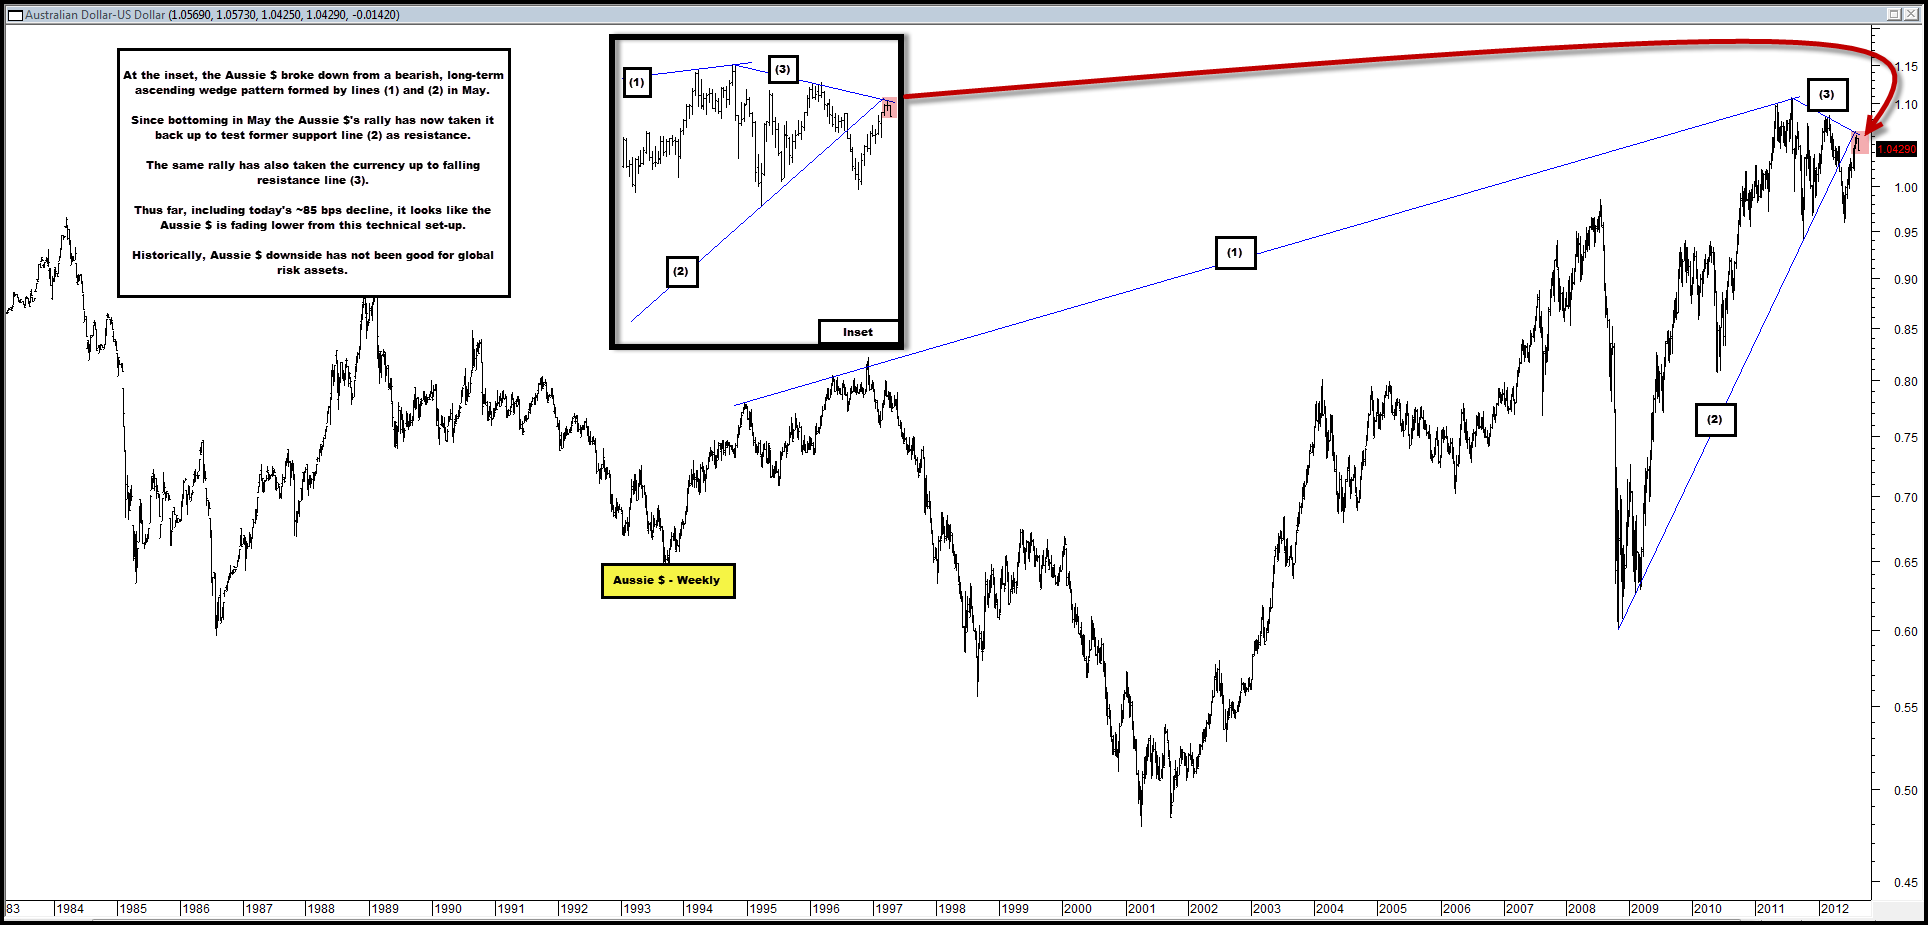
In May it broke down from a long-term, bearish ascending wedge pattern formed by lines (1) and (2).
Line (1) ran across its highs from 1995 onward while line (2) ran underneath its lows from 2008, 2009 and 2011.
Since that break-down in May, the global rally in risk assets has helped the Aussie $ as well, with it recovering to a recent high of $1.06 from a low of $0.96 in May.
In the process, that rally has taken it back up to test old support line (2) as new resistance as well as falling resistance line (3) from its 2011 and 2012 highs.
Thus far, it appears to be failing at this dual test of resistance, with the currency down ~85 bps today alone.
Historically, weakness in the Aussie $ has not been a positive for global risk asset or the global growth outlook – will the same be true again if we see further Aussie $ weakness emerge from this technical pattern, or is Europe a bigger driver now?

Comments are closed, but trackbacks and pingbacks are open.