Gold Faces its First Significant Test of Resistance Since Rallying 15% off its $1,525 Low
Over the past few months gold has rallied ~15% off its lows of $1,525.
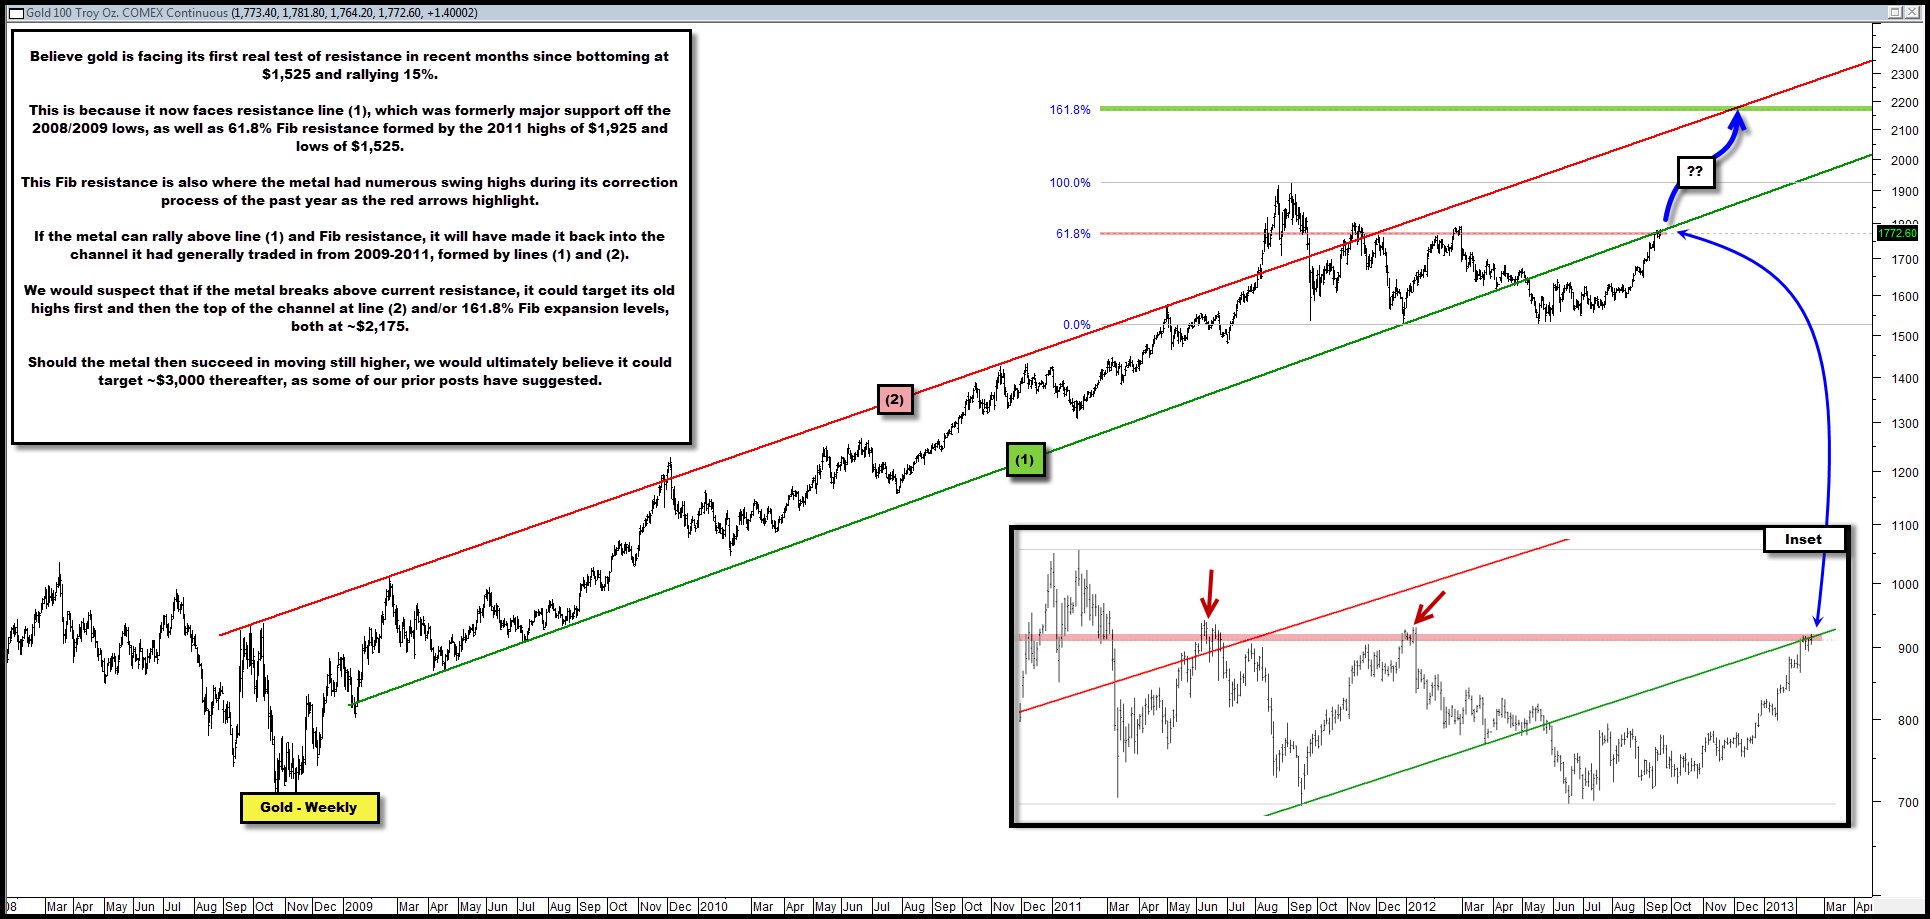
That rally has taken it up to two important resistance areas in the chart below including lines (1) and 61.8% Fib resistance formed b/t the metal’s 2011 highs of ~$1,925 and subsequent lows of ~$1,525.
This is also a price area that marked numerous swing highs for the metal over the past year during its sell-off/correction as the red arrows show.
If it can break above this resistance the metal will find itself back in the upward sloping channel it has generally traded in over the past few years formed by lines (1) and (2).
If this occurs, we would anticipate the metal might then target its old highs of ~$1,925.
A break above this level could then usher in the metal targeting the top of its channel at line (2) and/or the ~$2,175 level, which is its 161.8% Fib expansion level.
This is merely a intermediate-term price target set-up, should the metal continue higher.
Over time, if the metal’s bullish posture remains in tact, we suspect it could eventually target nearly $3,000.

Comments are closed, but trackbacks and pingbacks are open.