Getting Granular – Equities Currently Testing the Veracity of Their Recent Up-trend
By veracity we mean truth.
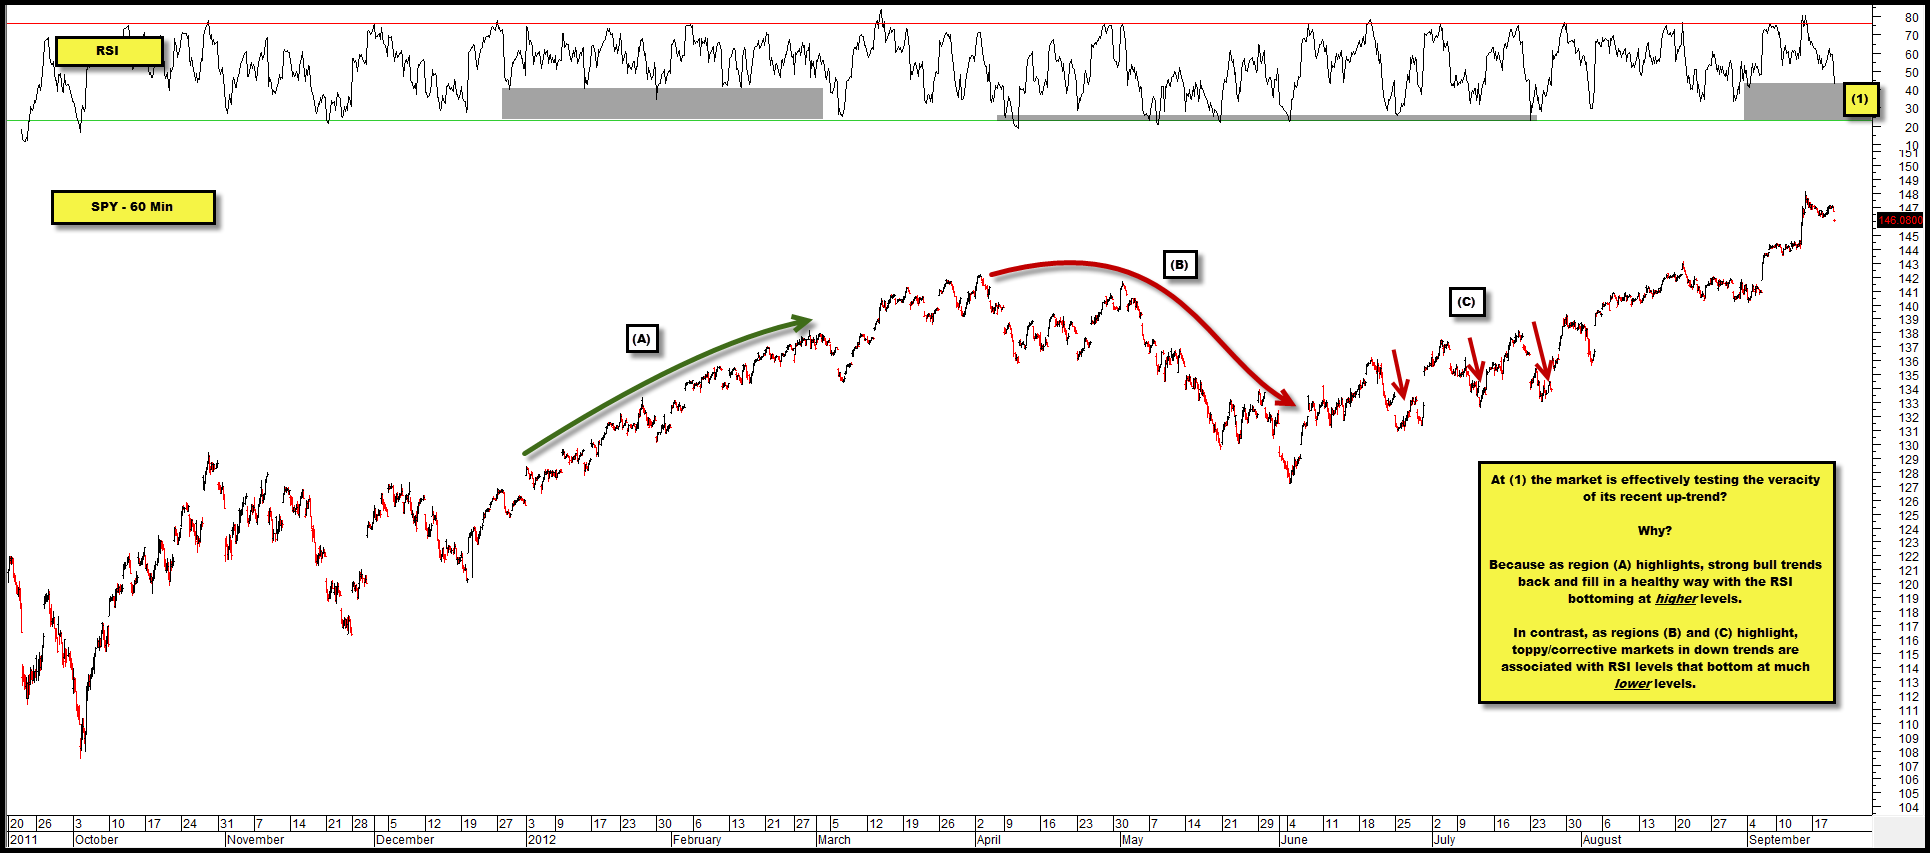
The chart below highlights the SPY on a 60 minute basis over the past year.
Note the level of the RSI at (1).
With this week’s selling it sits at a level that is typically associated with bottoms in strong, healthy bull trends, as region (A) highlights.
In contrast, toppy/corrective bear trends are associated with RSIs that bottom at noticeably lower levels, as regions (B) and (C) highlight.
If a bull trend is in place, the market likely needs to find some solid footing in the near-term.

Comments are closed, but trackbacks and pingbacks are open.