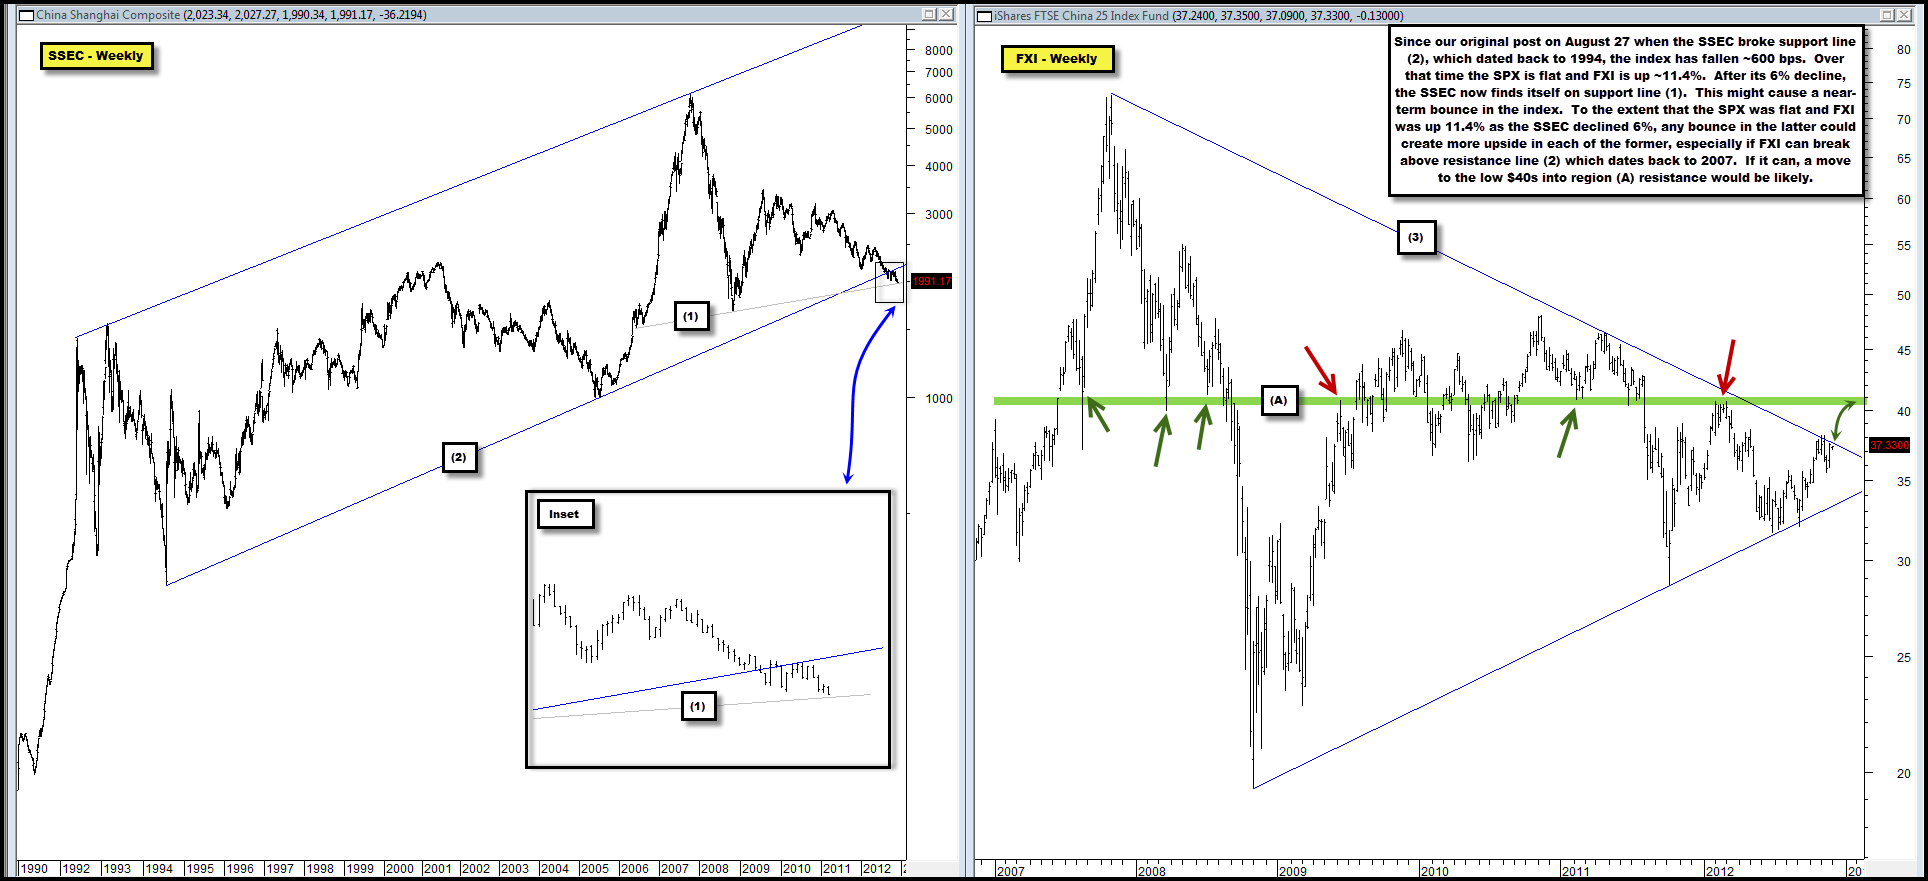
SSEC Finds itself at Another Important Support Zone as FXI Faces Resistance
All the way back on August 27th we noted the SSEC was in the process of breaking below long-term support dating back to 1994.
At the time, we noted that while such a break was unlikely to be an incremental positive, we doubted how much informational content the price action in the SSEC provided as a read through to other risk asset classes such as the SPX.
That appears to have been the correct assessment at the time, what with the SPX at 1,406 today vs. 1,410 as of that original post.
Regardless, with yesterday’s 130 bps decline to 1,991, the SSEC has once again reached a somewhat noteworthy area of support, provided by line (1) in the chart below.
There’s a decent possibility that support line could generate a bounce for the index in the near-term.
Though the SSEC is much different than FXI, which is an ETF representing a basket of domestic-listed Chinese companies, any bounce in the former could create a sympathy bounce in the latter, which faces resistance line (3).
Should FXI break above line (3) resistance, which dates back to 2007, it could then target region (A) where numerous swing highs and lows have occurred, in the low 40s.
Note that though the SSEC’s price action since our original post on the index on August 27th has been poor, with the index down 600 bps, FXI is up 11.4% over the same period, besting the SPX by the same amount and its SSEC counter-part by 17.4%.
Moreover, FXI is also up ~11% since our September 7th post on the ETF where we noted it was likely time to buy Chinese companies listed in the U.S.
Stay tuned in – to the extent that downside in the SSEC produced upside in FXI over the past few months, upside in the SSEC produced by support line (1) below may produce even more upside in FXI moving forward, especially if it breaks above line (3).

Comments are closed, but trackbacks and pingbacks are open.