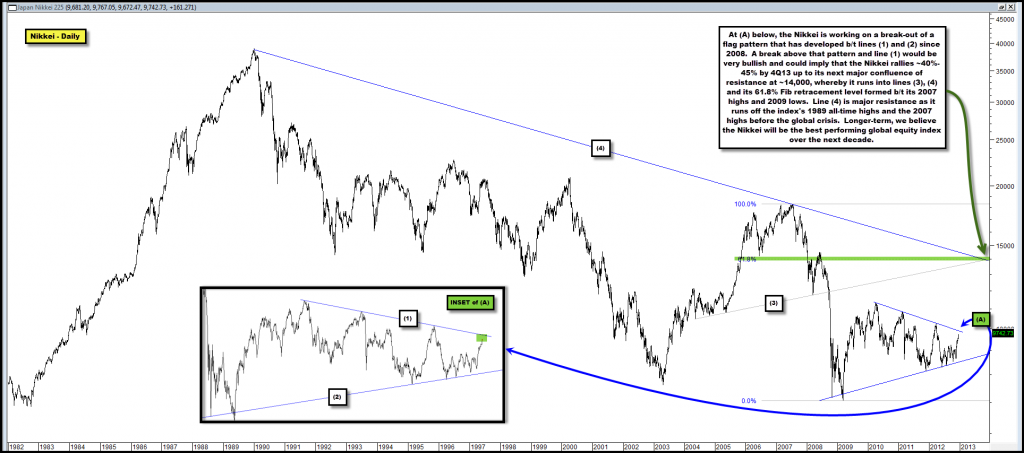
Nikkei Working on a Break-Out; Next Up 14K by the End of 2013?
In the chart below the Nikkei is attempting to break-out from a consolidation flag pattern formed by lines (1) and (2), which has been in development since 2008.
If a break-out occurs, it could result in materially more upside in the index, as it’s next major confluence of resistance stands some ~40%-45% higher, in the 14,000 area.
Assuming a date of 4Q13, in reaching 14,000 the index will face resistance points (3) and (4), the latter of which runs off its all-time highs in 1989 and 2007.
Additionally, 14,000 represents the Nikkei’s 61.8% retracement level formed b/t its 2007 highs and 2009 lows.
Stay tuned – a break above line (1) would be very bullish and would help to evince our ongoing and ardent support of the thesis that this index is apt to out-perform all other global equity benchmarks over the coming decade.

Comments are closed, but trackbacks and pingbacks are open.