Japan Chart Dump
I continue to believe, as crazy as it sounds, that the Nikkei might round-trip its 30-yr decline from 40K in 1989 by getting back to that level either this or next year.
I’ve outlined the case for this scenario two times on the site now, once in late 2017 here and once a few weeks ago in this follow-up post.
In the context of this ongoing view I thought it appropriate to take a deeper dive into the region by focusing on a few sectors and individual companies that have particularly interesting chart set-ups.
Here are the individual company set-ups I find interesting.
What might catalyze a move to 40K on the Nikkei? Tough to say specifically, but here are the index’s industries by weighting. The top five are in red.
I find the Banks to be the most important group in that top five and perhaps within the whole index.
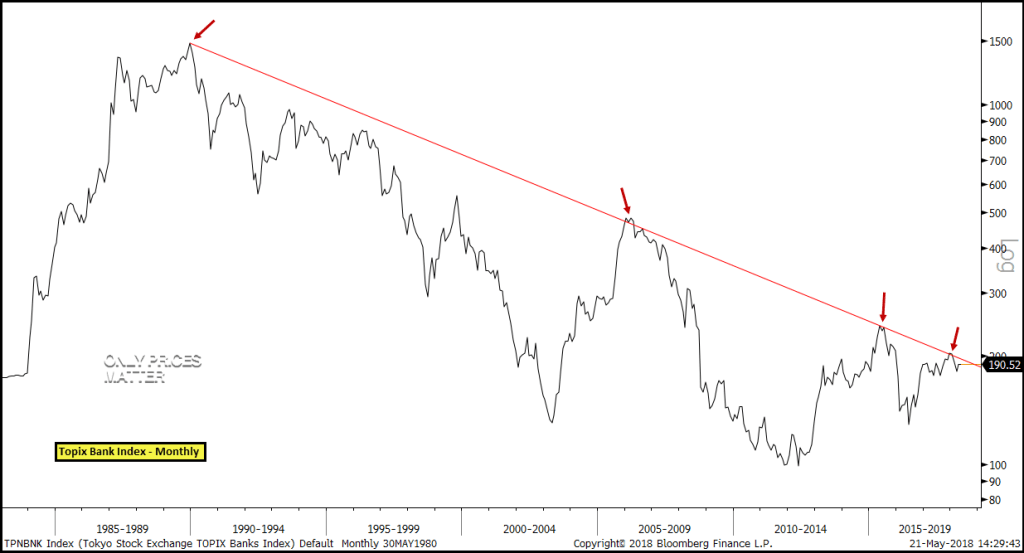
That’s because much of Japan’s 30-yr malaise rests squarely on the shoulder of the banks’ long-standing troubles, problem loan books and repeated recaps, all of which are a hold-over from the 1980s real estate bubble there. And it shows up in the Topix Bank Index chart below – a virtual straight shot lower for 30 years.
Thus, with the index seemingly testing the falling resistance of that 30-yr downtrend once again after a few previous failures over the years, any break above would likely be a significant, bullish catalyst for the overall country and the Nikkei/Topix themselves.
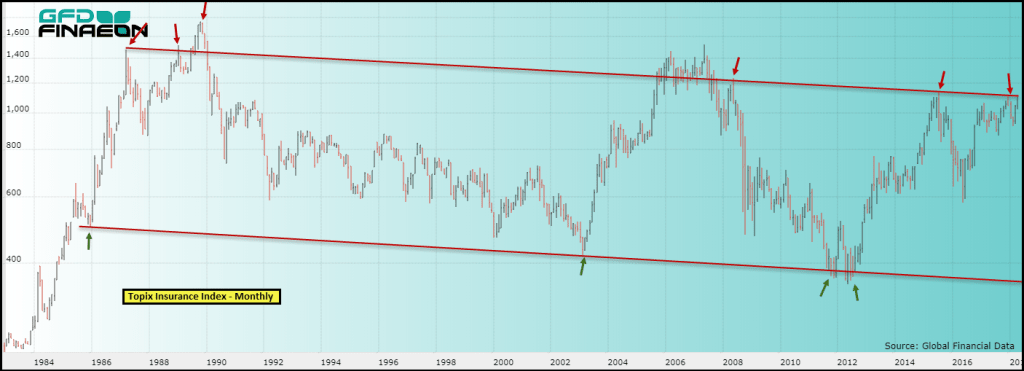
I also find the Topix Insurance Index particularly interesting as it battles 30-yr channel resistance in the chart below.
And, perhaps more than even the Nikkei itself, its pattern in recent years is highly emblematic of silver’s before it went parabolic in late 2010 into its summer 2011 high at $50.
In my view, the index is either at the point of breaking out like silver did as it went to $50 from $18, or it has a few more weeks – or a month or two – of remaining consolidation before initiating such a move.


