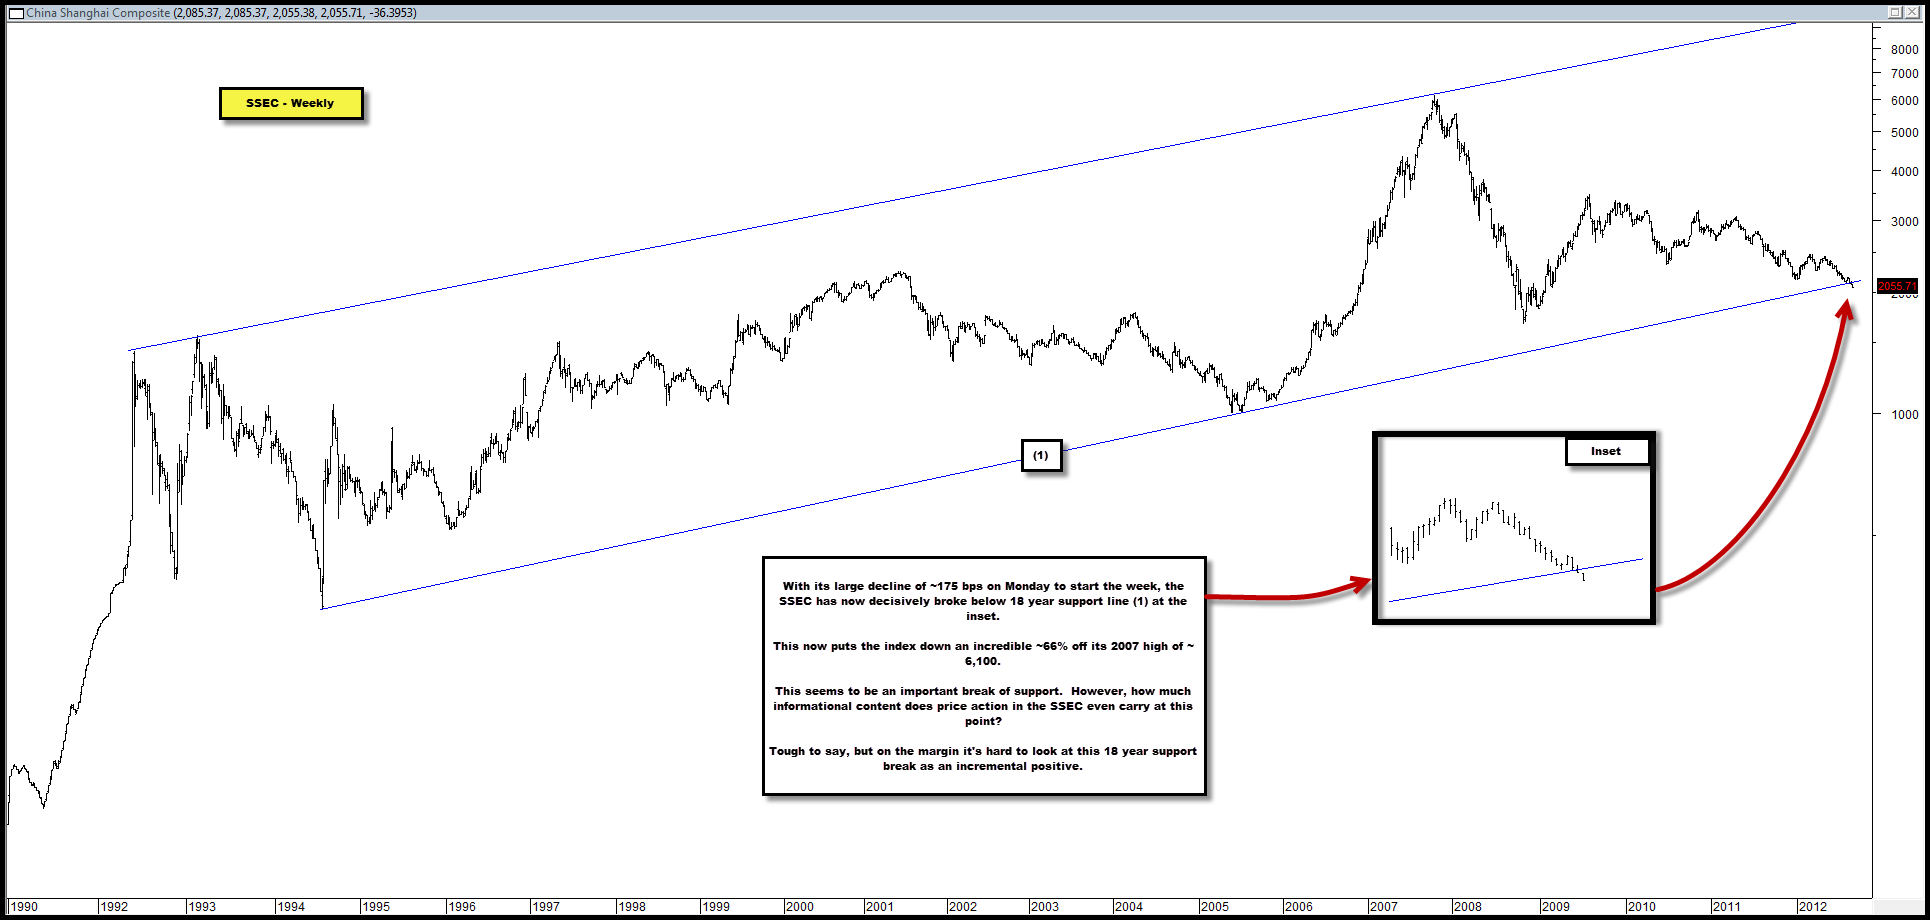
SSEC Just Broke Below Major Support Dating Back to 1994
With last night’s ~175 bps decline to start the week, the SSEC has now decisively broken below a nearly 20 year support line (1) dating back to 1994, in the chart below.
Incredibly, the index now stands ~66% off its 2007 high.
On the margin, we doubt such a long-standing break of support is an incremental positive.
On the other hand though, as we pointed out before, we question how much informational content one can gleam about the prospects for other risk assets and the global economy in general, from looking at the price action in the SSEC at this point.
Our doubts about its value come from the chart we highlighted in our July 30 post whereby we asked if a break below the support line in question, which just happened, would even be relevant.
Our skepticism was due to the fact that the SSEC has charted a classic post-bubble path since its highs in 2007 and that if it continued to do so, was likely in for many years more of listless and aimless downside.
Our thought was that an index that is already down 2/3 from its all time high and potentially has years more of listless trading ahead of it, likely has little relevancy remaining (even if China’s economy itself still remains very relevant).
Sure enough, the day after the SSEC breaks nearly 20 year support, it appears as if SPX futures are bid up ~40 bps pre-market.

Comments are closed, but trackbacks and pingbacks are open.