Despite 175% Rally From August 2011, S&P Homebuilder Index Still Has ~20%-50% More Upside
I’ll reiterate my very simple thesis on homebuilders which I’ve maintained for quite some time now:
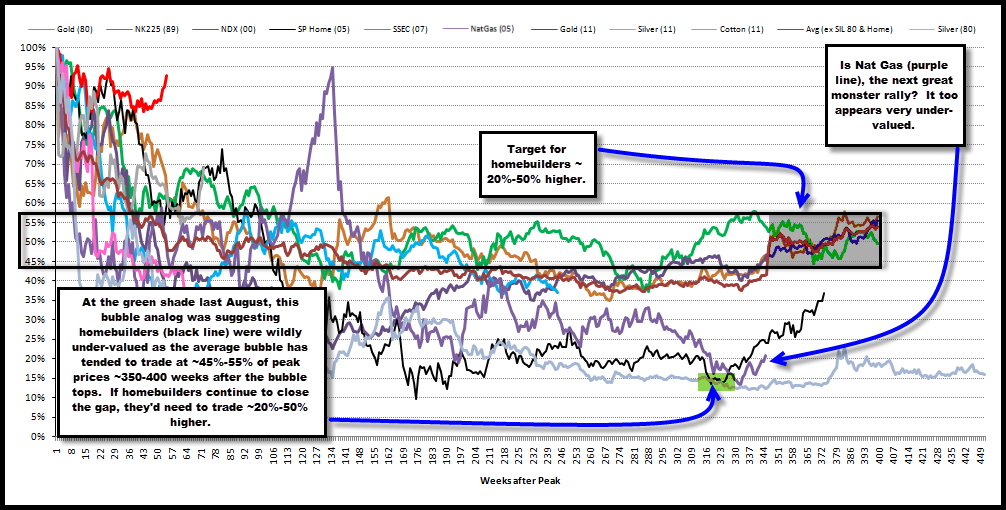
They remain noticeably under-valued relative to where other bubbles tend to trade ~350-400 weeks after their peak bubble prices.
This was much more so the case last summer/fall when the S&P Homebuilders index traded at a mere 10%-15% of its peak 2005 prices, but remains the case today and you potentially have Bernanke at your back spurring this on with MBS purchases.
As the analog study below suggests, most bubbles tend to congregate around the ~45%-55% level of their peak bubble prices at the +350-400 week juncture.
Despite the 175% rally off its Aug-11 low value of ~175, the S&P Homebuilders index, at 483 currently, still trades at only 37% of its peak price from 2005 of 1,306.
As such, should the index trade into the 45%-55% band it implies a rally of anywhere b/t 20%-50% higher to 587 (1,306*.45=587; 587/483 = 22% gain) or 718 (1,306*.55=718; 718/483 = 49%).
Self-explanatory, but clearly more upside for home-builders is possible.
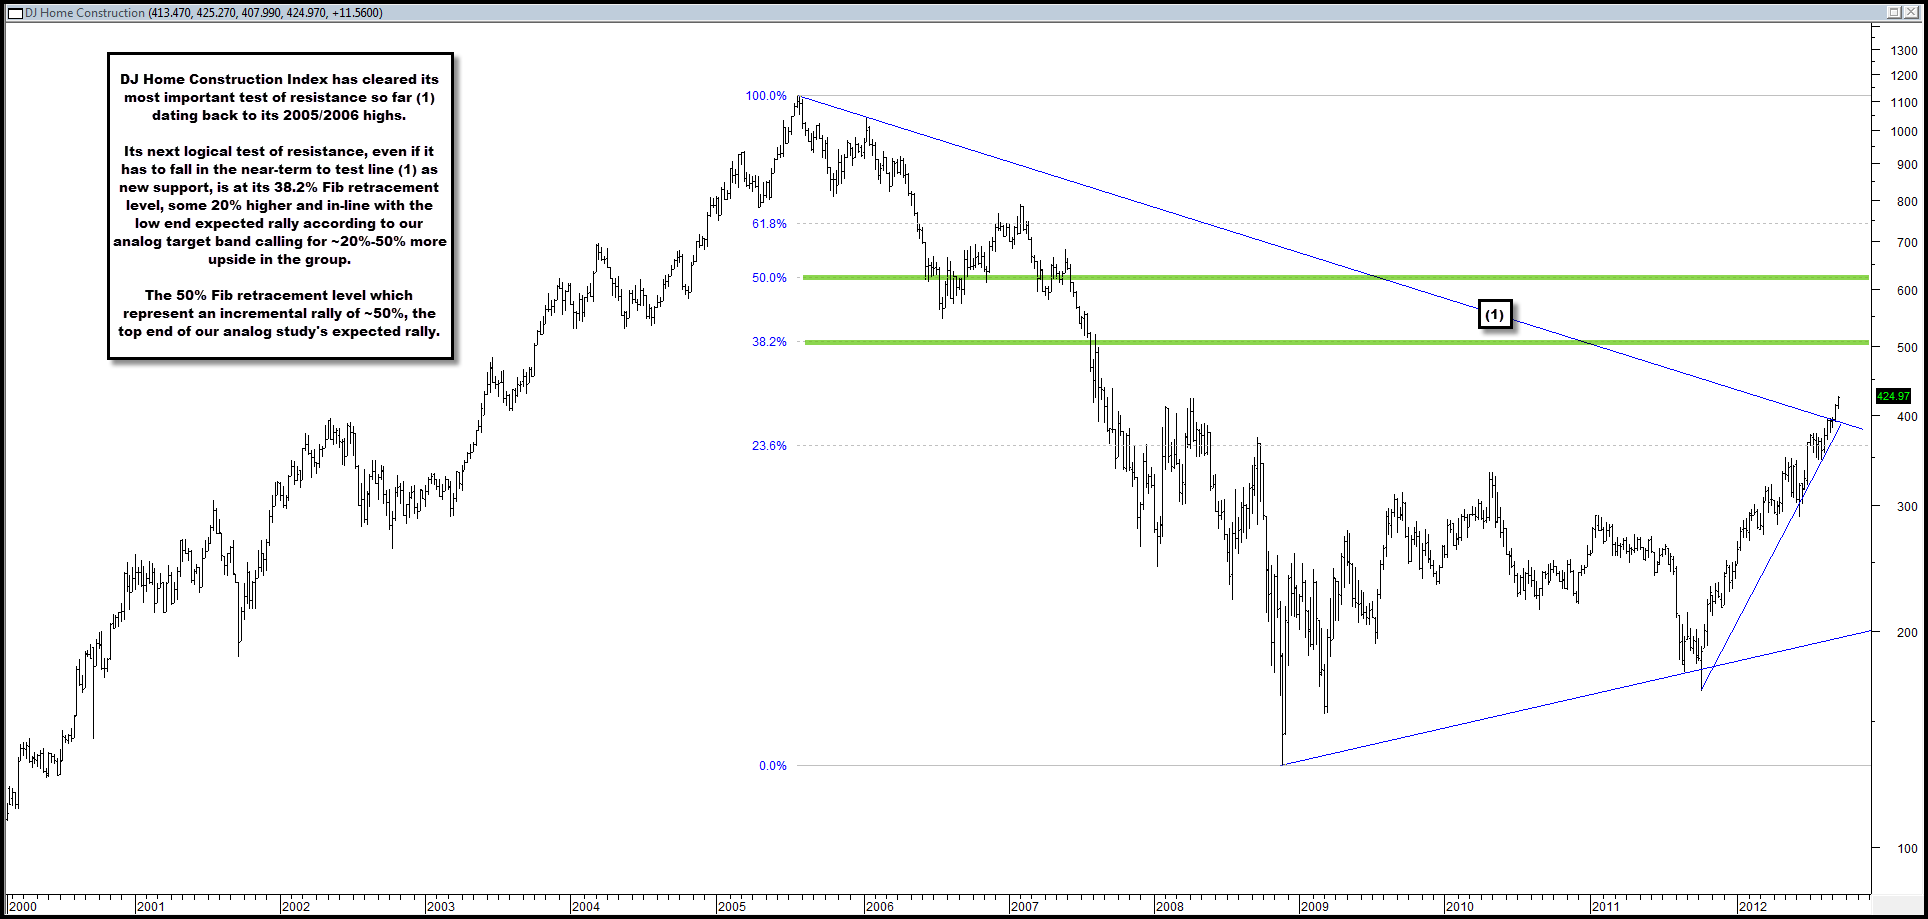
Further, the index has just broken key trend-line resistance as well.


Comments are closed, but trackbacks and pingbacks are open.