Bond / Stock Ratio Approaching a Level that has Coincided with Equity Tops Since 2007
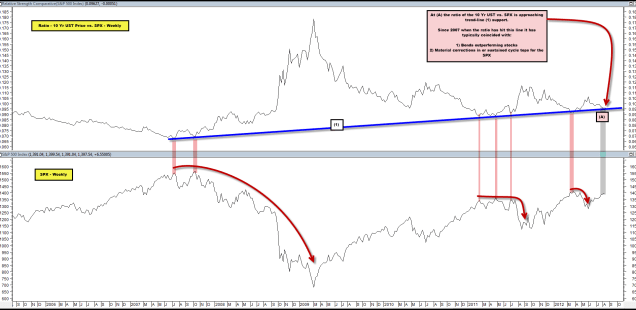
The chart below plots the ratio of the 10 Yr UST price vs. the SPX in the top pane and the SPX in the bottom pane.
When the ratio b/t the two has approached trend-line (1) since 2007, as it is doing now at (A), it has typically coincided with material corrections (Apr-Oct 2011) or actual cycle tops (2007).
Should the ratio break through line (1) we’d assume a period of sustained equity out-performance vs. bonds and absolute increases in equity prices is likely.
Until such a break occurs we probably need to respect the line with the expectation that it could produce results similar to the ones it’s produced since 2007, yet again.

Comments are closed, but trackbacks and pingbacks are open.