With 10 Yr Rates 25% Higher Since our Original Post, Were We Correct to Suggest on 7/17 that the Secular Bond Bull Was Nearing its End?
On July 17 we noted in a post that we believed the days of yield declines in UST securities was likely near an end.
And we meant from a secular standpoint, not a cyclical one.
We based this view on an analog comparison to Japan (contrary to some, we don’t “hate” analogs).
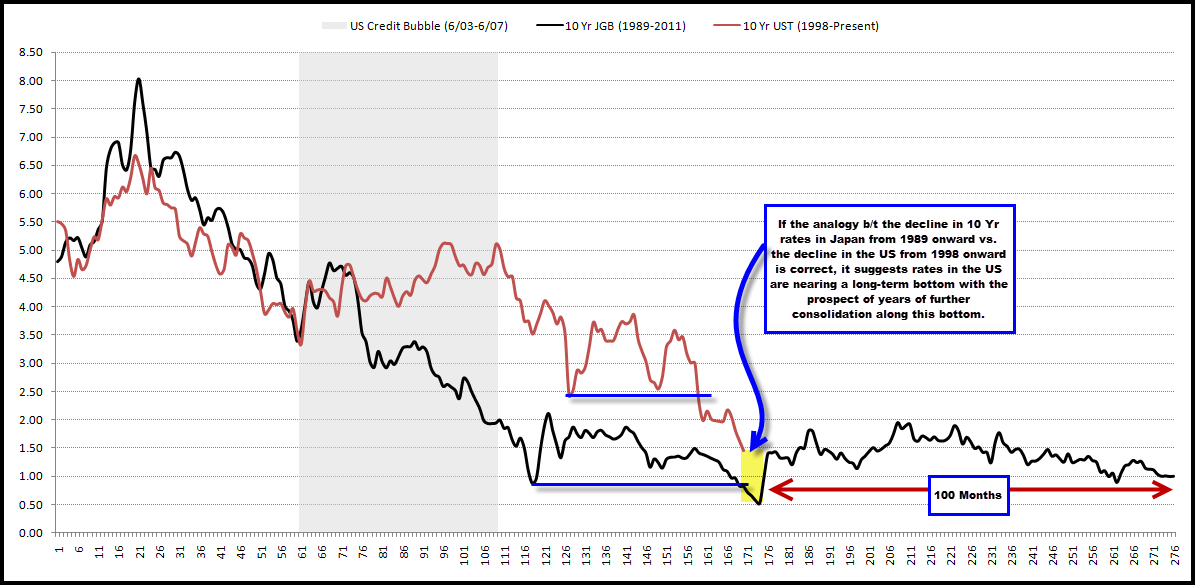
Specifically, we compared the decline in yields on Japanese 10 Yr JGBs from 1989 (top of their real estate and equity market bubbles) onward to the decline in yields on 10 Yr USTs from 1998 (when our internet bubble likely would have popped given global imbalances/LTCM began to flare that summer, were it not for the Fed stepping in) onward.
The similarities were notable and suggested UST yields were potentially about to bottom on a secular basis.
For ease of use, we reproduce the original chart below.
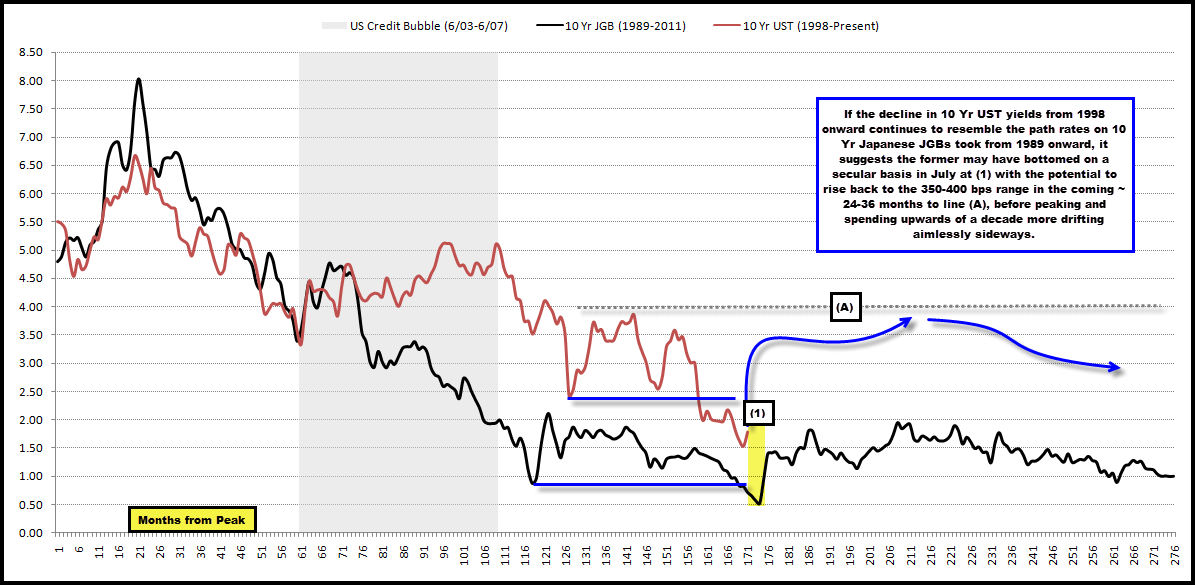
If we fast forward to today, or a month later, yields on the 10 Yr UST have risen by almost 25%, to 178 bps from 145 bps.
From an analog standpoint, here is what the chart above now looks like after accounting for the increase.
Given the sharp reversal higher in yields in only a month, point (1) in the US series increasingly looks like”the” secular bottom in the Japanese series where the yellow shade is.
If the analog remains true to form, we could expect yields on 10 Yr USTs to climb further, potentially to 350-400 bps, over the coming 24-36 months, before drifting sideways for years to come.
Given that 10 Yr UST yields in this series peaked in 1998 as gold prices were bottoming and given that gold prices peaked last year as UST yields were nearing an ostensible (to-date) bottom, what’s this mean for gold prices moving forward?


Comments are closed, but trackbacks and pingbacks are open.