
The SSEC Likely Continues Lower Though Its Irrelevancy Continues to Grow
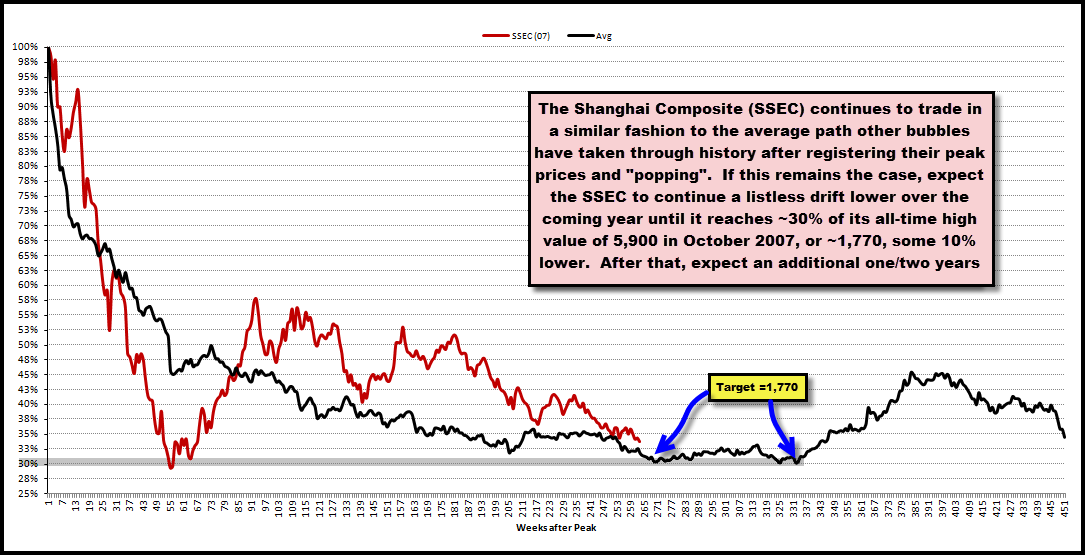
That thesis is largely derived from the chart below, which plots the path the SSEC has taken off its peak bubble prices in late 2007 and compares it to the path the average bubble has taken through history once peak prices are in the rear-view mirror.
With various puts and takes (we are comparing one asset to an average of all others) the SSEC continues to mimic the path the average bubble has taken once it’s popped.
If the analog continues to work, and I tend to think it will, the SSEC likely has a few more years of listless trading with a downward bias, with a proximate downside of target of ~1,770 a likely outcome.
1,770 on the SSEC would be ~30% of the index’s peak price of 5,900 from October 2007 and would be in-line with where the average bubble tends to bottom before trading sideways for years to come.
Regardless, everything we said in our original post on July 30th remains true today.
Expect at least ~10% more downside in the index into 1,770 and also expect the index to remain and increasingly become, irrelevant when it comes to providing read-throughs to the global economy and markets.
Comments are closed, but trackbacks and pingbacks are open.