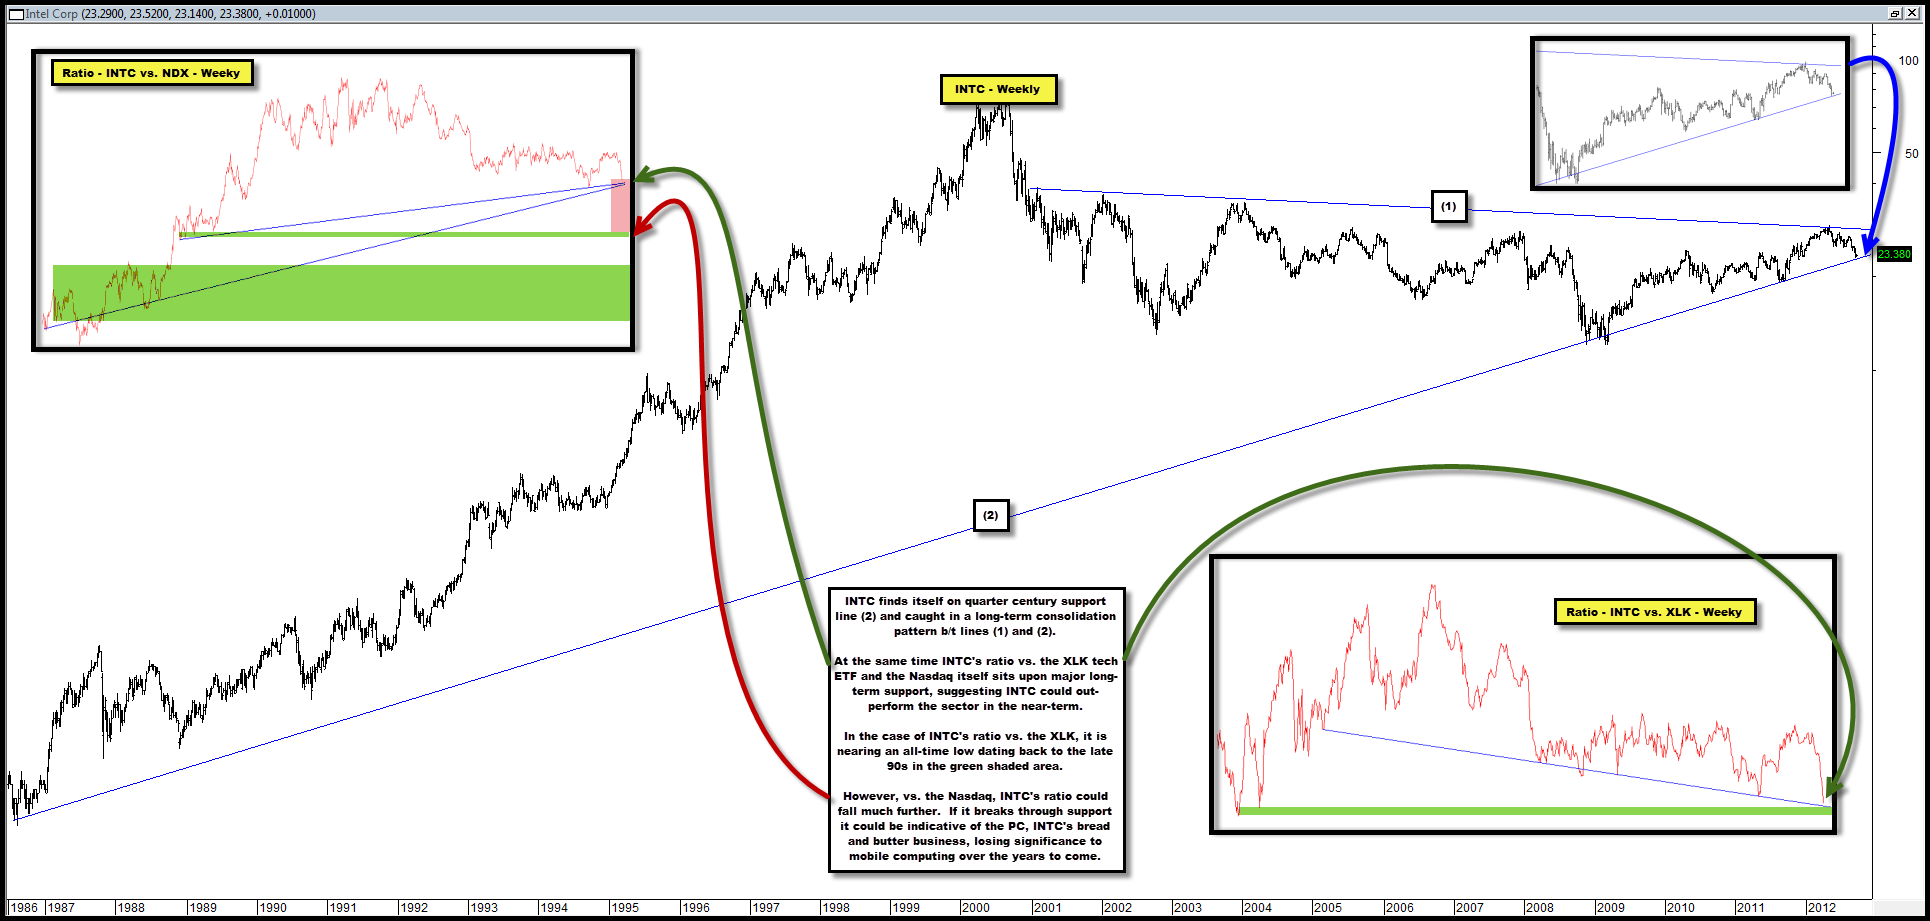
INTC Sitting On Quarter-Century Support Dating Back to 1986; Ratio of INTC vs. XLK Near All-Time Low
The chart below shows that INTC sits at quarter-century support line (2) dating back to 1986 while it is caught in a long-term consolidation pattern b/t lines (1) and (2).
At the same time, the ratio of INTC vs. the XLK technology ETF is near an all-time low dating back to the late 90s and is also at major support.
The ratio of INTC vs. the Nasdaq is also at major support, yet is still very elevated vs. its all-time lows.
Collectively, this suggests INTC could bounce in the absolute sense in the near-term and on a relative basis vs. the overall tech sector.
However, should it break below line (2) we would think it could severely under-perform the sector on a longer-term basis until its ratio vs. the Nasdaq finds support in one of the green shaded areas, both a good deal lower.
If such a break-down occurs, might it be indicative of the PC, INTC’s bread and butter business, losing relevancy vs. mobile computing, a space where INTC has much less clout?

Comments are closed, but trackbacks and pingbacks are open.