Working Thesis for 2013
Let’s just get this out of the way right up front – I was completely,unequivocally wrong to pivot to the “not-bullish / mildly bearish” camp late last week.
I think it’s quite clear that the combination of Monday’s ~25 pt SPX rally and the ~20 pt pre-market rally we’re seeing this morning evinces as much.
That pivot is probably the biggest mistake I’ve made on the site thus far since starting it. That said, I’ve merely foregone lost profit as opposed to incurring losses on the short side, which is a move we never espoused.
Moreover, I think both the quality and quantity of work we’ve had in justifying the multi-quarter cyclically/structurally bullish outlook we’ve had on global markets is good enough and clear enough in its implications that it should be rather easy to re-adjust our thinking back into the bull camp. Additionally, we continue to hold numerous single-stock long positions.
So, with all of that out of the way, I present our previous, broad-brushed global working thesis moving into 2013, followed of course by some updated analogs:
- Global economies, especially in Europe and China, are in the early stages of a cyclical upswing; the latter areas are apt to out-perform the U.S.
- The potential for a Euro break-up and the region’s tail risk were eliminated with Draghi’s “I will do anything it takes” comments; hard landing risk in China has dissipated
- Collectively, the latter two items offer a solid cyclical back-drop for global equities and risk assets to move higher in 2013
- U.S. equities just registered their 4th consecutive annual gain; this has happened only six other times in the past; when it has happened, “year 5” tends to be a materially bullish one if positive, which we have generally believed it would be
- If 2013 marks a 5th consecutive annual gain for U.S. equities and it’s a materially positive one, the Shiller P/E on U.S. stocks, currently in the high teens / low 20s, will end up in the mid 20s rivaling the level it stood at in 1901 and 1966 with both years ironically marking the years two of the past century’s four secular bear markets began (the Shiller PE stood at 30/45 at the onset of the other two in 1929 and 2000); coupled with the fact that this bull market is nearly four years old and long in the tooth, 2014 could be a very difficult year for stocks
- Commodities are likely to under-perform equities in 2013 and moving forward in general despite the potential for global “risk-on”; that said, to the extent that global economies are on a cyclical upswing, cyclical areas of the markets ex-commodities are likely to out-perform
Broadly speaking, the latter bullet points are things each of us have discussed at length over the past two/three quarters. None of it should be new, but all of it is worth repeating.
Now, moving on to the analogs.
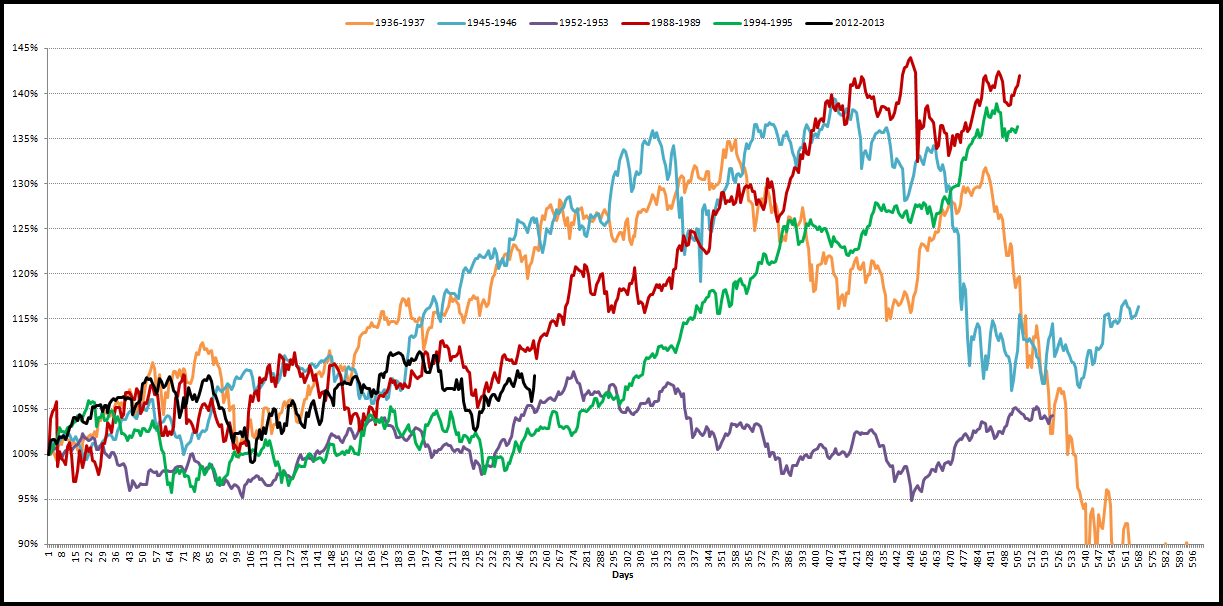
The first shows how the market has traded in year’s where’s gone on to register a 4th consecutive annual gain as it did in 2012, updated for Monday’s big gains in the Dow and today’s ~185 point pre-market gain.
We want to reiterate the following again: of the six previous examples of a 4th consecutive annual gain, year 5 included three rallies including +48% (1928), +27% (1989) and +33% (1995). Two of the three losses were negligible ones at -8% (1946) and -4% (1953) while one was large at -33% (1937). However, the irony of all three losses is they all were positive at some point in the year before finishing lower, two by material margins. Though 1937 finished the year with a 33% loss, at its high, it was up 9.0% during the year while 1946 was up 11.0% at the high before finishing with the aforementioned 8% loss.
Incredible! Can 2013 go on to produce gains similar to that 1928, 1989 or 1995? If the bullets from our fundamental thesis above are correct, it stands to reason this is a distinct possibility.
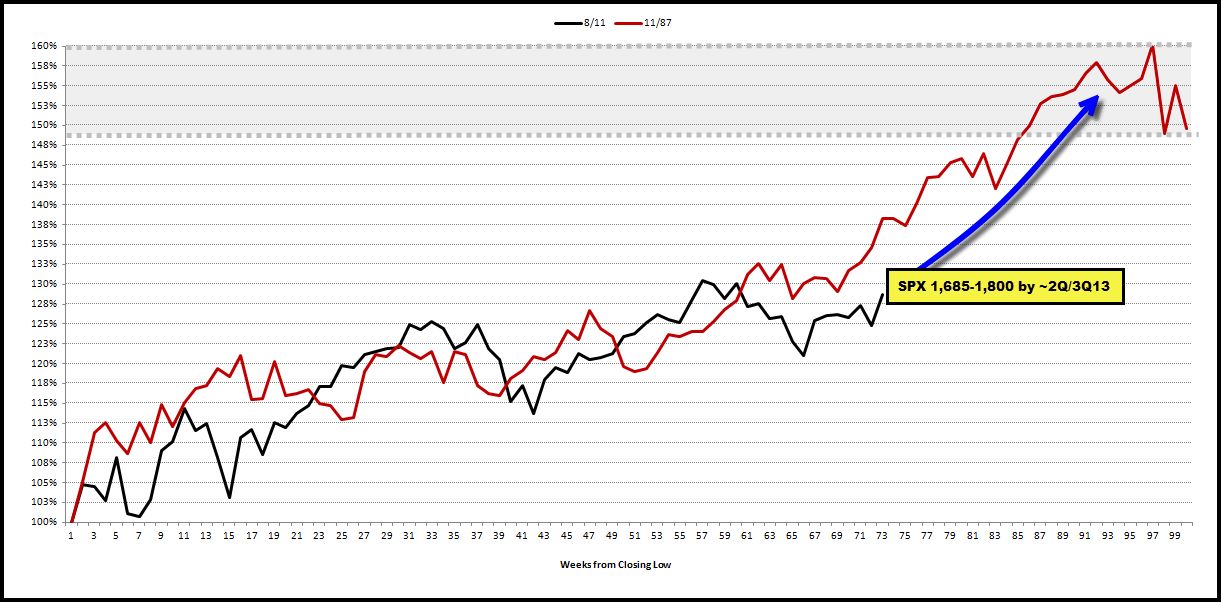
The next analog we present compares the moves off the weekly closing lows of the respective crash of October 1987 and mini-crash of summer 2011. I’ve updated the latter one to include Monday’s gains and today’s pre-market gains of ~20 points on the SPX. It has tracked incredibly well for quite some time before breaking recently. However, given the past two days worth of moves and the Fiscal Cliff deal, that gap could be on the cusp of closing again. Remember, if this analog is correct, it suggests SPX 1,685-1,800 by 2Q/3Q13.
Comments are closed, but trackbacks and pingbacks are open.