
Central Banks Have Done an Excellent Job of Back-Stopping Global Risk Appetite
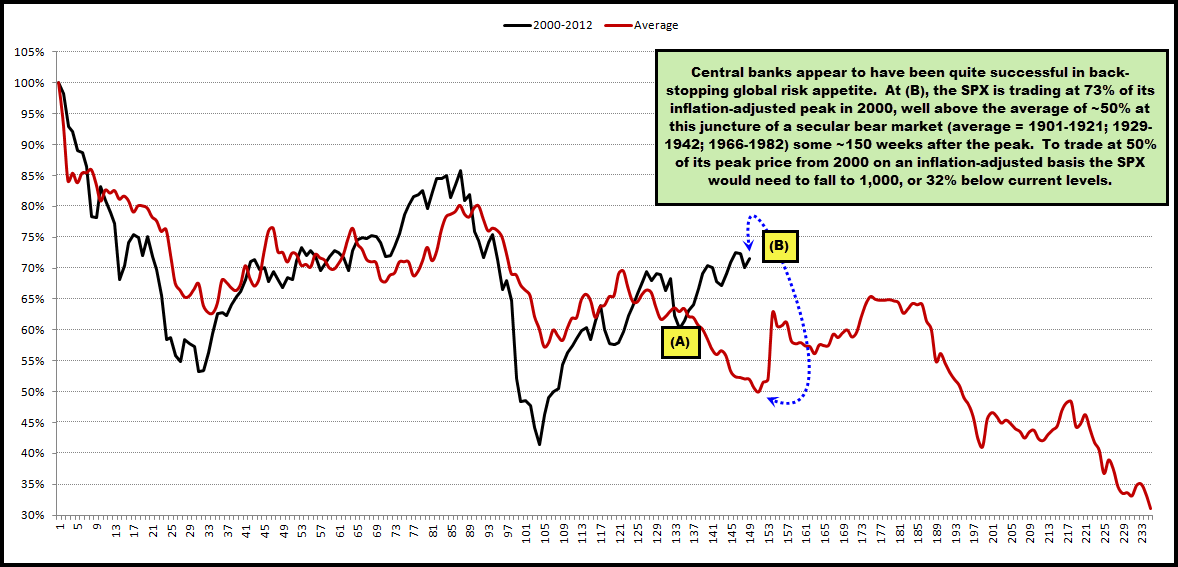
The chart below plots the average path that U.S. secular bear markets (1901-1921; 1929-1942; 1966-1982) have taken through history and compares it to the path the current (presumed) secular bear of 2000-2012.
The path of the current had plotted nearly perfectly with the average leading into point (A) in summer/fall 2011. At that point in time U.S. debt ceiling talks and accelerating Euro-zone contagion combined to create a mini-crash in the former and a full-blown crash in the latter.
In conjunction with those melt-downs, central banks responded with globally coordinated liquidity injections.
Those moves helped to create a monster one-year global equity rally, which has resulted in the SPX trading at ~73% of its inflation-adjusted peak at point (B).
By contrast, the average secular bear market at this juncture, some ~150 weeks after a secular bull ends, has traded at ~50% of its inflation-adjusted peak price.
To reach this level, the SPX would need to fall by ~32% to 1,000.
Now, there’s nothing written in stone that says the current secular bear has to trade in lock-step fashion with the path the average secular bear has taken through history. However, on an individual basis, the current one is still tied for the highest inflation-adjusted value of peak prices of any of the four we’ve now experienced dating back to the late 1800s, at this stage of the game.
So, regardless of whether we compare against an average or the individuals, the current one is still pushing valuations to what seem to be an outlier zone.
This does not necessarily make us bearish in 2013. However, should the year once again be a positive one (5th consecutive), and by a solid margin, it could make 2014 interesting given the analog below.
Comments are closed, but trackbacks and pingbacks are open.